Inside ProcessUnity Risk Index: What Makes Up the Rating and How to Use It
7 minute read
October 2026
ProcessUnity research conducted by our data science team recently found that third parties with weak ProcessUnity Risk Index scores are 47 times more likely to experience a breach. That finding raises a fair follow-up question for any risk team: What exactly goes into a ProcessUnity Risk Index score, and how much weight should you put on it when deciding to onboard, assess, or monitor a vendor?
A third-party risk score is only as useful as your ability to explain it. If you can’t show why a vendor landed where it did, you can’t defend a risk decision to leadership or an auditor, and you can’t tell the vendor what controls to fix. ProcessUnity Risk Index was built with that in mind. Every score comes with the ability to break down the data behind it, and the score updates when that data changes.
Here’s a look under the hood: Where the data comes from, how it’s weighted, what makes a score change, and how vendors and risk teams each put it to work.
Four Data Sources, One Explainable Score
Most security ratings look at a vendor from outside scans only. ProcessUnity Risk Index combines two perspectives.
- Inside-out data comes from the third party itself: Control intelligence collected through the ProcessUnity Global Risk Exchange, which includes both predictive and vendor-attested control data.
- Outside-in data comes from what the world can observe about the vendor, sourced from RiskRecon, Recorded Future, and Common Vulnerabilities and Exposures (CVE) monitoring.
Those perspectives aren’t weighted equally. Internally provided control data makes up 80% of the score, and externally observed security practices make up the remaining 20%. The split is deliberate, because control data is the most accurate indicator of how well a vendor is protected, while external signals validate that picture and add real-world context.
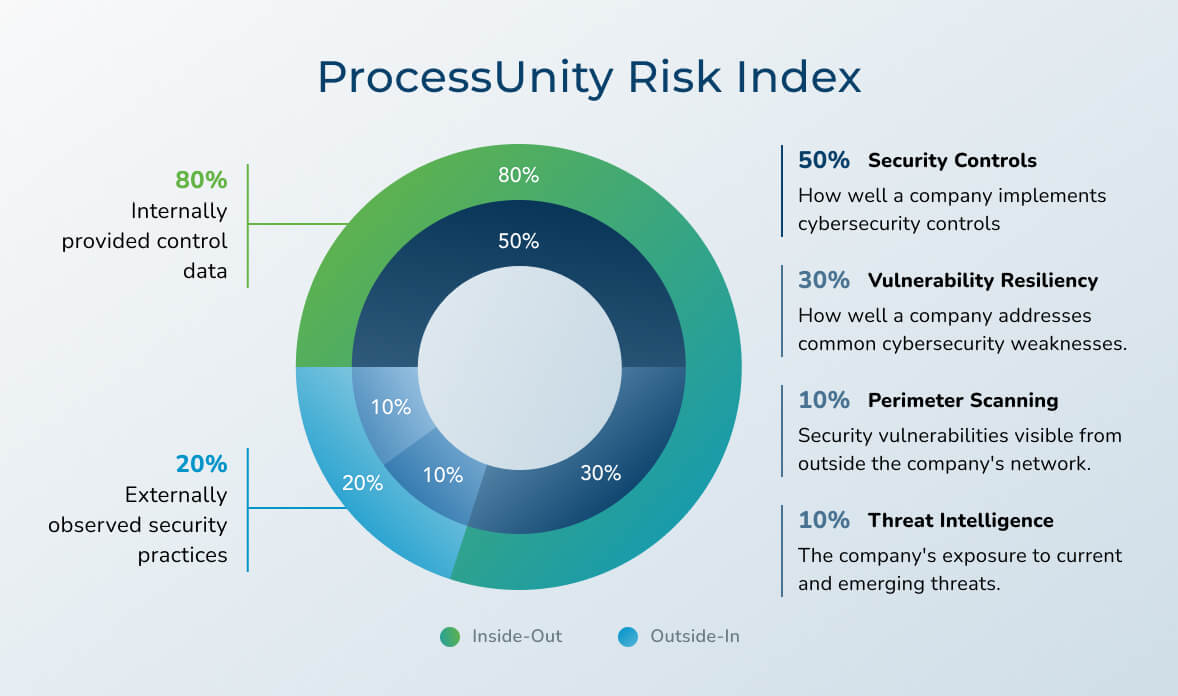
Under the hood, four weighted components roll up into that score. The first two come from the vendor’s own control data, and the last two come from what’s observable from the outside:
Internal control data
- Security Controls (50%): The largest share of the score measures whether a third party has the right cybersecurity controls in place and how well it has implemented them. This data comes from control responses shared through the Global Risk Exchange, covering more than 200 controls across 10 risk domains, and can be predictive or attested.
- Vulnerability Resiliency (30%): Having a control on paper isn’t the same as being protected. This component looks at how well a vendor’s controls hold up against common, well-documented cybersecurity weaknesses, giving more credit for controls that defend against more of them.
External risk data
- Perimeter Scanning (10%): This is what’s vulnerable from the attacker’s perspective. It captures security issues any bad actor could spot from outside the company’s network, such as exposed or misconfigured internet-facing systems, and acts as a real-world check on what the vendor reports.
- Threat Intelligence (10%): The final component reflects how exposed a company is to active or emerging threats, adding timely context that a periodic assessment can’t capture on its own.
See the Score, Understand the Controls
A single number is useful for sorting through a vendor portfolio, but it isn’t enough to act on. ProcessUnity Risk Index provides teams three levels of detail, so the right amount of data can be used at each stage of the third-party lifecycle:
- Risk Index Score and Rating: At the top level is the 100-point score, from Very Weak to Very Strong, that summarizes a third party’s controls, external perimeter, and threat intelligence. It’s built for a fast ‘yes, no, or maybe’ at onboarding, due diligence, and monitoring.
- Risk Domain Index: Informing the top-level score are scores for 10 cyber risk domains, so you can see exactly which areas a vendor holds strong and where it falls short. The Risk Domain Index focuses your review effort on the weaker domains that are relevant to you.
- Control Index: Each Domain Risk Index score is compiled via the Control Index, which rates vendor performance across more than 200 cyber controls, organized into those 10 domains and mapped to Common Weakness Enumerations (CWEs).
That CWE mapping is what drives weighting at the control level. Controls tied to more known weaknesses carry more weight, because they have more impact on reducing real-world risk. When a score drops, you can trace it to the specific controls behind it instead of guessing.
Why the Score Moves
Point-in-time ratings go stale the day after the assessment closes. Risk Index scores refresh nightly, and whenever a third party provides new data through the Global Risk Exchange. Three kinds of change move a score:
- New control data. When a vendor updates its responses on the Exchange, its inside-out data changes.
- Predictive data is enriched by attestation from the vendor. Where a vendor hasn’t shared data yet, Risk Index uses predictive scoring so you still have coverage. As the vendor provides and validates its own control data, that evidence replaces the prediction.
- New external signals. Changes in perimeter scans, threat intelligence, or newly published vulnerabilities update the outside-in view.
For Vendors: How to Directly Impact Your Score
Traditional security ratings give vendors no way to participate in their own score. With 80% of ProcessUnity Risk Index built on control data the vendor provides, third parties have real influence over where they land, and a clear path to improve it:
- Claim your profile on the Global Risk Exchange. It’s free, and it’s the starting point for replacing predictive data with your own.
- Share and keep your control data current. Your score refreshes as you update your responses, so it reflects your program as it is today, not as it was at your last assessment.
- Validate your controls. Validated evidence carries more confidence than predictions or unverified answers.
- Prioritize the controls that carry the most weight. The Control Index breaks down which controls are tied to the most known weaknesses, so remediation effort can be targeted where it will move the score the most.
A stronger score also makes client due diligence easier. Customers who can see vendor controls directly tend to send fewer questionnaires and follow-ups. For a closer look at the vendor side, read how third parties can improve their ProcessUnity Risk Index.
For Risk Teams: Using Scores to Monitor Risk
For customers, the score earns its keep between assessments. Because Risk Index refreshes continuously, it works as a monitoring signal, not just an onboarding filter:
- Score and domain changes surface shifts in posture. A meaningful drop in a vendor’s overall score or in a single domain is a reason to look closer, without waiting for the annual review.
- New vulnerabilities become a short list. When a new CVE is published, ProcessUnity Risk Index identifies which of your third parties use the affected technology, cross-references their control strength, and surfaces the ones with weak controls to assess first.
- Signals turn into tracked work. Inside the ProcessUnity TPRM Platform, monitoring changes can open issues tied to specific controls or domains, launch mitigation plans with owners and deadlines, and track remediation to closure.
The result is a portfolio view that stays current, and a team that spends its time on the vendors that actually need attention.
See the Score in Action
Understanding what goes into a third-party risk score is the first step. Seeing it applied to your own vendor list is the next one. Join the ProcessUnity Product team for a live demo of Risk Index, or explore the ProcessUnity Risk Index page to learn more.
Frequently Asked Questions
A third-party risk score summarizes a vendor’s cybersecurity risk posture in a single number, so risk teams can prioritize which vendors need deeper review. ProcessUnity Risk Index is a controls-based third-party risk score that combines a vendor’s own control data with externally observed signals.
ProcessUnity Risk Index score is 80% internally provided control data and 20% externally observed security practices. It breaks down into Security Controls (50%), Vulnerability Resiliency (30%), Perimeter Scanning (10%), and Threat Intelligence (10%), and rolls up into a 100-point score from Very Weak to Very Strong.
The score refreshes nightly, and whenever a third party provides new data through the ProcessUnity Global Risk Exchange. Changes in external signals and newly published vulnerabilities also update the third-party risk score.
Yes. Because Risk Index mainly comes from control data the vendor provides, third parties can raise their score by claiming their Global Risk Exchange profile, keeping control data current, validating controls, and remediating the highest-weighted controls first.
Predictive data estimates a vendor’s control posture when the vendor hasn’t shared its own data yet, so risk teams still get coverage. Validated data is evidence the vendor has provided and verified. As validated data comes in, it replaces the prediction in the vendor’s third-party risk score.
Risk teams watch for changes in a vendor’s overall score, domain scores, and external signals between assessments. Inside the ProcessUnity platform, those changes can trigger issues, mitigation plans, and remediation tasks, and new CVEs are matched to the third parties most likely to be exposed.
Related Articles

Vendor Risk Analysis: How to Prioritize...
In our inherent risk series, we’ve explored what an inherent risk rating is and how..
Learn More
What is ProcessUnity Risk Index? A...
Third-Party Risk Management (TPRM) teams have never had more trouble collecting information about their vendors...
Learn More
How One TPRM Programme Can Satisfy...
When the UK’s financial regulators finalised their new third-party reporting rules, they did something regulators..
Learn More
The PRA and FCA Rewrote the...
When the Prudential Regulation Authority published PS7/26, most third-party risk teams filed it under “reporting..
Learn More
Generic AI Can’t Replace TPRM Busy...
An intake queue that quietly hides a duplicate vendor for four days. A SOC 2..
Learn More
How to Build a Vendor Risk...
Third-party ecosystems are growing faster than most Third-Party Risk Management (TPRM) teams’ capacity to assess..
Learn More
Your TPRM Program Doesn't Need a...
Two third-party risk teams are piloting AI tools in the same quarter. The first team..
Learn More
Why a Cybersecurity Assessment Isn’t Enough:...
On July 19, 2024, a faulty content update from CrowdStrike crashed roughly 8.5 million Windows..
Learn More
TPRM Maturity: Why Your Operating Model...
The surface-level metrics say your Third-Party Risk Management (TPRM) program is working. Assessments are moving...
Learn More
Step-by-Step Framework for Incorporating AI Into...
Third-Party Risk Management (TPRM) teams face a familiar challenge: the business wants vendors to be..
Learn More
The Future of Data and AI...
UNITE 2026: Fort Lauderdale brought together a record number of ProcessUnity customers, partners, industry experts,..
Learn More
What Is an Inherent Risk Score...
Third-Party Risk Management (TPRM) teams often manage hundreds, if not thousands of third parties, each..
Learn More
HyperTPRM: A Smarter Model for Third-Party...
Every year, Third-Party Risk Management (TPRM) teams are asked to do more. Vendor ecosystems are..
Learn More
What "TPRM Orchestration" Means, And Why...
Your Third-Party Risk Management (TPRM) program can probably send a questionnaire automatically, score a vendor..
Learn More
Take Control of Your Risk Reputation:...
For years, third parties had little control over how their cybersecurity posture was represented. External..
Learn More
Scaling Trust with Third-Party Data Exchanges:...
As third-party risk management (TPRM) programs continue to evolve, organizations are under increasing pressure to..
Learn More
AI Agents in TPRM: Deterministic Automation,...
Ask three Third-Party Risk Management (TPRM) practitioners how they're using AI, and you'll get three..
Learn More
When AI Shouldn’t Decide: Determinism, Judgment,...
by Todd Boehler, Chief Strategy Officer, ProcessUnity There’s a growing assumption in Third-Party Risk Management:..
Learn More
UNITE 2026 London Recap: Customer Conversations...
UNITE 2026: London brought together customers, partners, industry experts, and ProcessUnity leaders for two unforgettable..
Learn More
The AI Illusion in TPRM: Why...
Over the past year, there’s been a noticeable shift in the Third-Party Risk Management (TPRM)..
Learn More
ProcessUnity Risk Index vs. Traditional Security...
Let’s be honest. Security ratings always promise to simplify third-party risk. A single score. A..
Learn More
Verizon Completes Annual Refresh of Global...
ProcessUnity is pleased to announce that Verizon updated its Global Risk Exchange Assessment, bringing refreshed..
Learn More
ProcessUnity Expands TPRM Portfolio with Transfer...
We’re excited to share an important update on ProcessUnity’s continued growth. S&P Global has decided..
Learn More
ProcessUnity is a Leader in the...
The results are in: ProcessUnity is a Leader in the 2026 Forrester Wave™: for Third-Party..
Learn More
The Third-Party Risk Maturity Gap: What...
Third-party risk management programs have never been more visible to stakeholders, regulators, and even your..
Learn More
The Future of TPRM: 5 Innovations...
Third-party risk management is at a turning point. For years, risk teams have wrestled with..
Learn More
Third-Party Risk Management Implementation Roadmap: 6-Step...
In today’s hyperconnected environment, where 98% of organizations have at least one third-party partner that..
Learn More
A Modern Four-Step Playbook for Managing...
When a new vulnerability appears in the wild, security and third-party risk teams feel the..
Learn More
ProcessUnity 2025 Year in Review: Building...
As 2025 comes to a close, it’s clear this was a defining year for ProcessUnity...
Learn More
How to Build a Compliant, Future-Ready...
A third-party vendor completes your annual assessment, responds to all the required questionnaires, and meets..
Learn More
The Smarter Way to Manage Third-Party...
Third-party risk management (TPRM) is at an inflection point. Organizations are grappling with expanding vendor..
Learn More
Why Making Life Easier for Your...
In the complex world of third-party risk management (TPRM), organizations often focus on internal efficiencies—automating..
Learn More
Take Control of Your Risk Score:...
For too long, third parties had to live with incomplete, often misunderstood representations of their..
Learn More
How Modern Risk Teams Are Harnessing...
If you’re running a Third-Party Risk Management (TPRM) program today, you’re already familiar with the..
Learn More
Lessons from the Drift/Salesloft Breach: A...
When news broke in September 2025 that Drift and its parent company Salesloft had suffered..
Learn More
Announcing the ProcessUnity Trust Center: Transparency...
When it comes to meeting risk and compliance standards for your business, trust is the..
Learn More
Introducing Assessment Autofill: Transforming How Third-Party...
If you’re part of a client security assurance team, you know the feeling all too..
Learn More
Manual vs Automated Vendor Risk Assessment:...
Every third-party relationship is an entry point for risk. With the average enterprise managing hundreds,..
Learn More
Why AI Alone Isn’t Enough: The...
Artificial Intelligence (AI) is currently the headline act in third-party risk management (TPRM). From auto-answering..
Learn More
From Long Hours to Instant Insights:...
Third-party risk teams face a growing challenge. As the volume and complexity of third-party assessments..
Learn More
Artificial Intelligence, Real Human Value: Deliver...
When you use manual processes, third-party risk management (TPRM) can soak up valuable time and..
Learn More
Good Data Pays for Itself: ProcessUnity...
No matter what size your organization, you probably rely on third parties. If your organization..
Learn More
Cut Risk, Not Corners: Streamlining the...
The modern organization relies on a larger, more integrated network of third parties and suppliers..
Learn More
Top 5 Features to look for...
Third-party vendor breaches are escalating at an alarming rate. In 2023, 61% of organizations reported..
Learn More
The Evidence Overload Problem: Why Third-Party...
In third-party risk management (TPRM), evidence documentation is everything. It’s how third parties prove they..
Learn More
5 Critical Regulations Reshaping TPRM in...
The pressure on financial institutions to manage third-party risk is mounting — and the stakes..
Learn More
Closing the Gaps: 8 Third-Party Risk...
Third-party relationships are a double-edged sword: opportunity and business functionality on one side, but an..
Learn More
ProcessUnity’s UNITE 2025 San Diego Sets...
Last week, ProcessUnity hosted UNITE 2025 San Diego, our trailblazing customer summit. This edition of..
Learn More
How Third-Party Vendor Risk Disrupts Business...
Your third-party vendors are delivering on time, business operations are efficient and planned, and customers..
Learn More
Mapping Assessments Across Standard Frameworks More...
Maintaining a standard security framework has become increasingly crucial for businesses in today’s digital age...
Learn More
Third-Party Risk Management ROI Calculator: Measuring...
Imagine starting your day knowing exactly where your vendor risks lie and the status of..
Learn More
10 Critical Third-Party Risk Management Challenges...
Every vendor relationship can introduce potential vulnerabilities to your business, and in today's hyperconnected business..
Learn More
How to Choose the Right Third-Party...
The clock is ticking, and your team is buried under a pile of vendor risk..
Learn More
How to Facilitate Third-Party Risk Assessments...
Managing third-party risk is a complex and resource-intensive challenge for most organizations. Traditional risk assessments..
Learn More
Ensure Ongoing DORA Compliance Across Your...
The Digital Operational Resilience Act (DORA) is a regulatory framework established by the European Union..
Learn More
Predicting Global Trends for 2025: What...
Read our 2025 predictions for regulatory impacts, from ProcessUnity VP of Product Management Sandeep Bhide...
Learn More
Bridging the Third-Party Vulnerability Gap: Four...
Third-party risk management is at a tipping point when it comes to vendor assessments. Organizations..
Learn More
The AI Advantage for TPRM: Turning...
As AI technology advances, security leaders in third-party risk management (TPRM) face a stress-inducing choice:..
Learn More
Third-party risk: Re-thinking vendor assessments
Third parties can introduce substantial risk into global supply networks, but rigorous vendor risk assessments..
Learn More
Best Practices for DORA Preparation
The enforcement deadline for the EU Digital Operations Resilience Act (DORA) is approaching fast—as of..
Learn More
Key Provisions for DORA Preparation
The EU’s Digital Operations Resilience Act (DORA) will be enforceable starting January 27th 2025, and..
Learn More
ProcessUnity DORA Enhances Operational Resilience
As the January 2025 DORA enforcement deadline approaches, regulated entities and their ICT suppliers face..
Learn More
July 19, 2024 - The CrowdStrike...
Introducing Threat and Vulnerability Response for quick and efficient third-party risk management of emerging threats ..
Learn More
How Organizations and Vendors Use a...
A third-party risk exchange is a transformative concept designed to make third-party risk management (TPRM)..
Learn More
Implementing Advanced Third-Party Risk Management Workflows...
According to Gartner, 60% of organizations work with more than 1,000 third parties. With ecosystems..
Learn More
Managing Third-Party AI Risk
Artificial Intelligence presents third-party risk management (TPRM) professionals with a serious challenge and a profound..
Learn More
Ransomware Attacks in Healthcare: How to...
Healthcare organizations are common targets for cyber and ransomware attacks. Because organizations in this industry..
Learn More
5 Red Flags by Third-Party Risk...
Third-party risk management (TPRM) teams have a challenging job: they must evaluate a large volume..
Learn More
Deploying an AI-powered Third-Party Risk Management...
Artificial Intelligence (AI) impacts third-party risk management (TPRM) practices, whether or not your TPRM team..
Learn More
ProcessUnity is a Leader in the...
The results are in: ProcessUnity is a Leader in the 2024 Forrester Wave™ for Third-Party..
Learn More
Quantify Financial Risk to Prioritize Third-Party...
When you quantify financial risk across your third-party ecosystem and prioritize the most critical remediation..
Learn More
FDA Cybersecurity Regulations Add Medical Device...
As more medical devices are produced to function wirelessly and with network capabilities, the risk..
Learn More
NIST CSF 2.0 Draft Emphasizes Cybersecurity...
The National Institute of Standards and Technology’s Cybersecurity Framework (NIST CSF) has helped organizations of..
Learn More
Mature Your Cyber Program with a...
Risk-based cybersecurity risk management is the process of identifying, tracking and mitigating the risks to..
Learn More
The Relationship Between Privacy vs Security...
30 years ago, privacy, security, and risk management were rarely used in the same sentence...
Learn More
3 Practices to Ensure Supply Chain...
Supply chain resilience, or the ability to withstand and manage disruptions to your supply chain..
Learn More
Electric Utilities and the Domino Effect...
A few years ago, cyberattacks with physical effects, like Stuxnet, were relatively unheard of. In..
Learn More

Inside the Breach: Unraveling Iconic Data...
If you were to Google “cyber attacks on critical infrastructure,” you would get over 27..
Learn More
How the SEC Cybersecurity Rule Impacts...
As of July of 2023, public companies are subject to new cybersecurity disclosure requirements from..
Learn More
From Infiltration to Execution: Understanding the...
There is no silver bullet, although, believe it or not, there is a silver lining..
Learn More
Unveiling the Power of a Risk...
If you feel overwhelmed by bespoke security questionnaires, you're in good company. Many understand the..
Learn More
Controls-Based Versus Risk-Based Cybersecurity Programs
In the face of an escalating regulatory burden and increasingly common data breaches, many teams..
Learn More
3 Key Takeaways from ICON plc’s...
ICON Plc recently received the award, “Best in Class Third Party Risk Management—Large Enterprise,” from..
Learn More
Manage Cybersecurity Risk with the SCF...
The Secure Controls Framework (SCF) Risk Management Model can be a powerful tool for teams..
Learn More
CyberGRX Ranked on the 2023 Inc....
It’s been said that good things happen in three’s, and that’s certainly true with the..
Learn More
Use Software to Follow OCC 2023-17...
The Federal Reserve, Federal Deposit Insurance Corporation (FDIC), and the Office of the Comptroller of..
Learn More
21 Cybersecurity Training Resources
According to Statistica, the global cost of cybercrime is expected to reach a staggering $24..
Learn More
The SEC Cybersecurity Rule and the...
When the government perceives those entrusted to its care are in danger, it takes action—..
Learn More
What Role Does AI Play in...
Would you use AI to support your third-party risk decisions? We’ve recently witnessed AI morphing..
Learn More
Cybersecurity Through the Years and How...
“Security is a process, not a product.” - Bruce Schneier From the mainframes of..
Learn More
3 Takeaways from Retail Cybersecurity Breaches
Retail businesses process large quantities of transactions and customer data, making them common targets for..
Learn More
CyberGRX and ProcessUnity Combine to Form...
July 12, 2023 – CyberGRX and ProcessUnity announced today that the Third-Party Risk Management (TPRM)..
Learn More
ADP Reaches CyberGRX Exchange Risk Assessment...
ADP has reached a significant assessment-sharing milestone, sharing its validated cyber risk assessment over 1,000..
Learn More
Optimize Vendor Onboarding by Aligning with...
During the vendor onboarding process, both cybersecurity and procurement manage the amount of risk brought..
Learn More
How ISO 27002 Prepares You for...
ISO 27002 is a powerful tool to demonstrate your information security commitments to customers, investors..
Learn More
CyberGRX Enables Microsoft to Expedite Risk...
We are pleased to recognize Microsoft for expediting the sharing of risk assessments and merging..
Learn More
MOVEit Breach Fallout | LastPass Regrets...
In this episode of GRXcerpts: The MOVEit Breach Fallout Continues LastPass Reflections and Regrets Updates..
Learn More
Align Your Organization with the NYDFS...
The NYDFS Cybersecurity Regulation (23 NYCRR 500) is a set of rules designed to enforce..
Learn More
Malicious Chrome Web Extensions | Cyber...
In this episode of GRXcerpts: Malicious extensions found on the Chrome Web Store Cyber insurers..
Learn More
Mitigate Shadow IT Risk Internally and...
Shadow IT, or technology that’s used without being documented or vetted by cybersecurity personnel, poses..
Learn More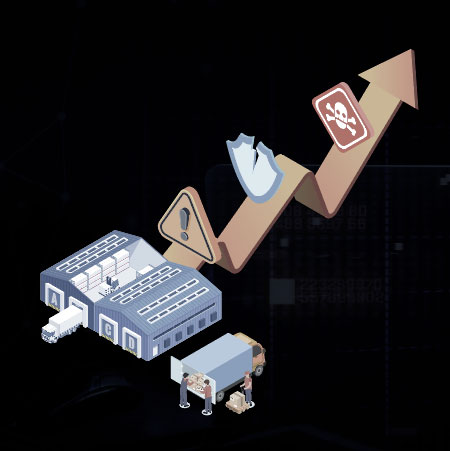
Navigating the Supply Chain Risk Landscape...
The supply chain risk landscape continuously changes, posing constant cyber risks and threats to manufacturers...
Learn More
Manufacturing Under Attack: Unmasking the Risks...
According to the World Economic Forum, manufacturing is one of the most targeted sectors by..
Learn More
Inside the Breach: Why & How...
One single vulnerability is all a hacker needs. In 2022, manufacturing firms suffered more than..
Learn More
Standing Tall: The Role of Security...
A resilient security posture shouldn’t be taken for granted, especially with a constantly changing threat..
Learn More
Align Your Cybersecurity Program with NIST...
Aligning your cybersecurity program with NIST 800-53 involves mapping your controls and policies to the..
Learn More
3 Ways to Prepare Your Cybersecurity...
SOC 2 compliance can be a powerful tool for all aspects of your business—it can..
Learn More
Google's New Top-Level Domains | Microsoft...
In this episode of GRXcerpts: Google’s top-level domains open doors to new attack vectors Warnings..
Learn More
Navigating the Cybersecurity Landscape of Energy...
Cyber threats pose a serious risk to energy systems globally, potentially bringing critical energy infrastructure..
Learn More
Responsibly Defend Cybersecurity's Budget
Though the cybersecurity function is as crucial as ever, recession, inflation and widespread layoffs have..
Learn More
The Risk Reporting Dilemma: Balancing Transparency...
No one likes to be the bearer of bad news, but even though it’s a..
Learn More
3 Features to Look for in...
Choosing the right third-party risk management tool for your organization requires identifying the functionality that..
Learn More
The State of Cyber Risk Management...
In the financial services industry, cyber risks and threats have become an inherent part of..
Learn More
Rising Threats & Risk Management Challenges...
In 2023 the insurance and finance industries were the second-most targeted sector in terms of..
Learn More
Inside the Breach: Understanding Patterns &...
Insurance and financial companies, with thousands of corporate and private clients, are lucrative targets for..
Learn More
The Top Risk Management Challenges Facing...
Retail and hospitality organizations now find themselves in the cybersecurity line of fire. According to..
Learn More
QR Code Scams | Q1 Cyber...
In this episode of GRXcerpts: Alarming new QR code scams Cyber attack stats for Q1..
Learn More
Inside the Breach: Unmasking the Types...
Without question, technology has revolutionized how we do business today. But with great power comes..
Learn More
The State of Cyber Risk Management...
Risk represents the potential for damage when a threat source exploits a vulnerability. In the..
Learn More
The State of Cyber Risk Management...
Risk is an ever-present threat, capable of inflicting substantial harm when vulnerabilities are exploited by..
Learn More
Managing Cyber Risk in the Digital...
The increasing demand for technology solutions in an era of digital transformation presents both opportunities..
Learn More
How to Choose Trust Service Criteria...
Selecting Trust Service Criteria (TSC) is a crucial step in achieving SOC 2 compliance: the..
Learn More
CyberGRX Ranks Among Highest-Scoring Businesses on...
Inc. Magazine has recognized CyberGRX as a Top Workplace 2023, honoring 591 exceptional companies from..
Learn More
Inside the Breach: Analyzing Iconic Data...
The US hospitality market was worth $4.1 trillion in 2022 and will see strong growth..
Learn More
Why Ignoring TPRM is Increasing Your...
It seems that not a week goes by without a data breach or cyber attack..
Learn More
3CX Hackers Target Critical Infrastructure |...
In this episode of GRXcerpts: 3CX hackers target critical infrastructure A warning to critical infrastructure..
Learn More
Using Third-Party Risk Management Software for...
Third-party risk management (TPRM) is an umbrella term for the process of tracking and mitigating..
Learn More
CyberGRX Announces Winners of the Inaugural...
April 26, 2023 – CyberGRX, provider of the world’s first and largest global risk exchange,..
Learn More
CyberGRX Named Winner In 11th Annual...
April 24, 2023: Cyber Defense Magazine announced today that CyberGRX won a 2023 Global InfoSec..
Learn More
Nth Party Relationships and Supply Chain...
No person–or company–is an island. In today’s interconnected, digital world, most, if not all, organizations..
Learn More
A Control Metaframework Can Unify NIST,...
Cybersecurity teams often need to achieve compliance with multiple regulations, standards and frameworks. The sheer..
Learn More
The Impact of the SEC Cyber...
In this special edition of GRXcerpts, we’re diving into the pending SEC cybersecurity regulation and..
Learn More
Pushing Boundaries: Accelerating Risk Decisions With...
The alarming volume of cyber attacks that businesses and organizations face today emphasizes the need..
Learn More
Prepare for DORA with a Cyber...
Cyber risk management is now a requirement for financial organizations in the EU and the..
Learn More
3 Takeaways about Anti-Bribery and Corruption...
Anti-bribery and corruption programs grant businesses visibility into their internal practices and third-party networks to..
Learn More
How Well Do You Know Your...
How well do you know your third parties? Are your records accurate and up-to-date? Modern..
Learn More
CyberGRX Named Security Visionary in EMA...
April 4, 2023 - Enterprise Management Associates (EMA), a leading IT and data management research..
Learn More
QR Code and PDF Scams, ChatGPT...
In this episode of GRXcerpts, we’ll cover technologies you thought were relatively safe but might..
Learn More
3 Due Diligence Obligations for the...
The German Supply Chain Act (LkSG), effective as of January 1, 2023, imposes new due..
Learn More
Your TPRM Program Must Account for...
Global conditions, from civil unrest and political turmoil to questionable government practices, can affect operations..
Learn More
Managing Cyber Risk Amidst a Growing...
As the world becomes more interconnected, businesses increasingly rely on third-party vendors to provide essential..
Learn More
The Impact of SVB on Cybersecurity,...
In this episode of GRXcerpts: The Impact of SVB on Cybersecurity New TSA measures for..
Learn More
Show Executives that Cybersecurity Drives Operational...
One strong approach to justifying your cybersecurity budget to executive leadership is to show how..
Learn More
Add Data and Risk Intelligence to...
CyberGRX is proud to announce the launch of our ServiceNow VRM integration, designed to provide..
Learn More
CyberGRX Integrates with ServiceNow to Streamline...
March 15, 2023 – CyberGRX, provider of the world’s first and largest global risk exchange,..
Learn More
CyberGRX Recognized for Innovation and Collaboration...
CyberGRX has been named the recipient of eight awards from the 2023 Cybersecurity Excellence Awards..
Learn More
Third-Party Risk Management: the Key to...
Scroll through social media, and you’ll come across many motivational tips and challenges about..
Learn More
Maturing Your Program with a Cyber...
Many organizations spread their cybersecurity budget between a variety of technologies, services and vendors: they..
Learn More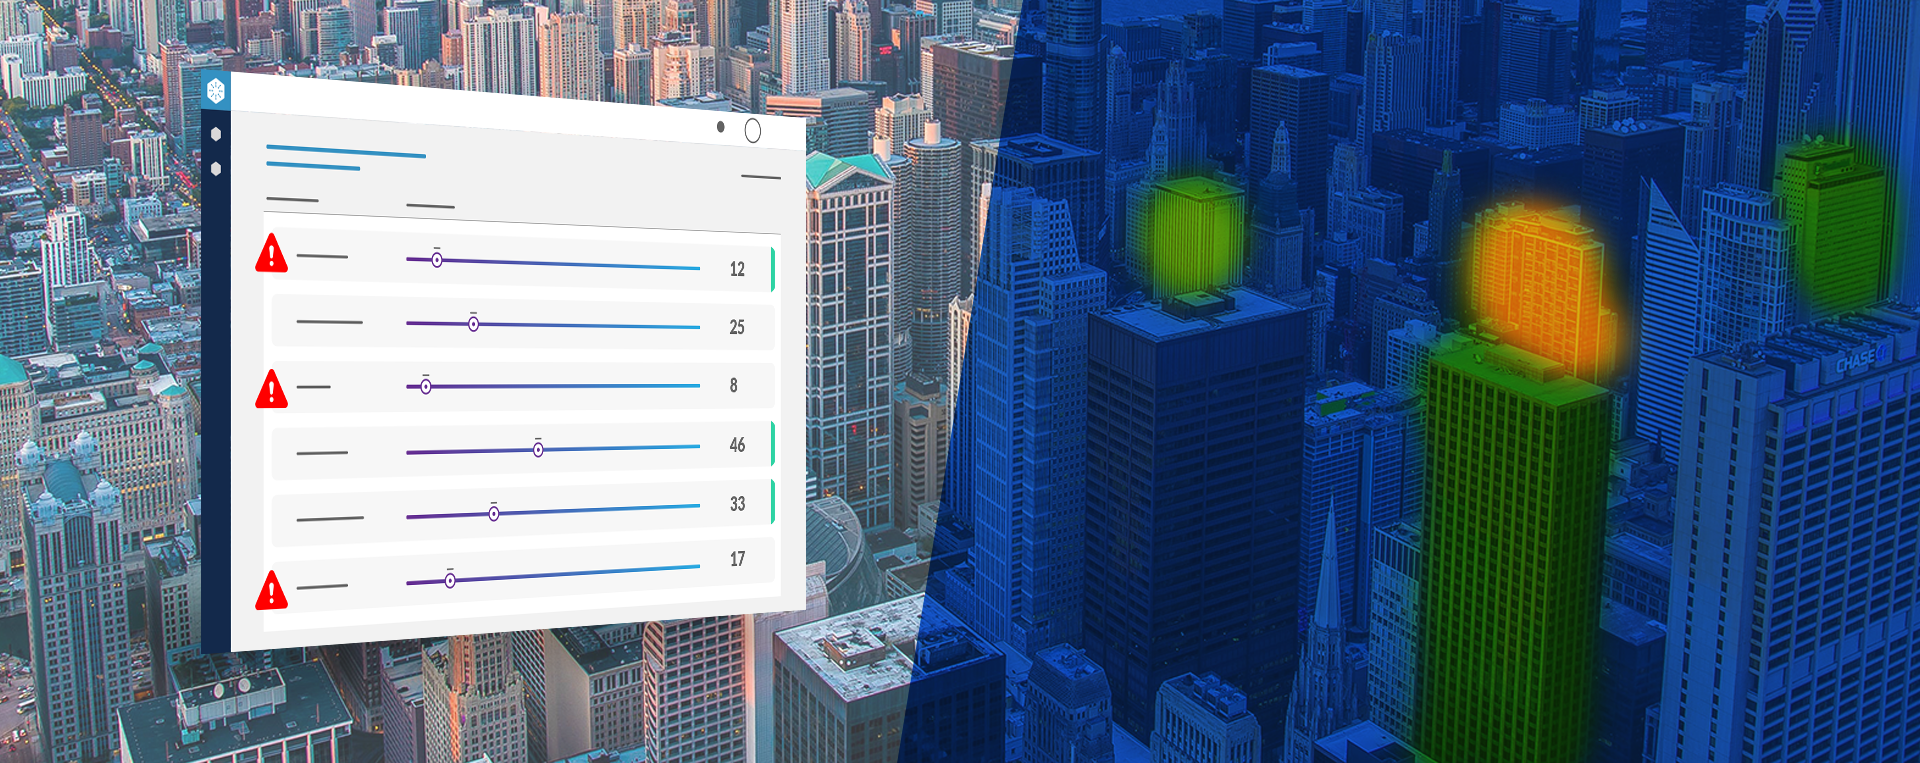
Discover Hidden Portfolio Vulnerabilities and Evolve...
Portfolio Risk Findings highlights the risk hidden inside your portfolio when analyzed through a specific..
Learn More
New Rules Strengthen SEC Cybersecurity Oversight...
The United States Securities and Exchange Commission (SEC) has recently announced a set of new..
Learn More
Data Risk Management Challenges and Best...
Protecting your data against unauthorized access and cyberattacks is hard. And, cybersecurity teams often question..
Learn More
CISO Stress Report, Dole Supply Chain...
In this episode of GRXcerpts: Are CISOs too Stressed? The Dole Supply Chain Disruption Ongoing..
Learn More
New FSRA Guidance Emphasizes Operational Risk...
The Financial Services Regulatory Authority of Ontario (FSRA) recently released guidance for credit unions and..
Learn More
4 Tips for Justifying a Bigger...
Economic uncertainty presents cybersecurity teams with new challenges: while each round of big tech layoffs..
Learn More
Diversity in Cybersecurity: What It Means...
In 2020, a reckoning emerged in the wake of several high-profile racial incidents. As the..
Learn More
Overcoming TPRM Shortages with Risk Prioritization
It is not uncommon for organizations to have hundreds of third-party relationships. And, a..
Learn More
3 Tips for Aligning Internal and...
While cybersecurity traditionally owns control assessments, they need help from procurement to get a true..
Learn More
CyberGRX Launches Portfolio Risk Findings to...
February 22, 2023 – CyberGRX, provider of the world’s first and largest global risk exchange,..
Learn More
Clop Ransomware, New Credential-Stealing Malware, Prioritizing...
In this episode of GRXcerpts, get updates on: Clop Ransomware and GoAnywhere MFT Vulnerabilities New..
Learn More
Are Third-Party Social Engineering Gaps Leaving...
Phishing is one of the top ploys used by cybercriminals to gain access to your..
Learn More
How Healthcare Security Leaders Can Mitigate...
Healthcare organizations have faced serious challenges in recent years, and while the pandemic has been..
Learn More
How to Be Proactive About Incident...
Let’s face it, the threat of cyber attacks is a constant concern. No matter what..
Learn More
Cybersecurity News: Hive Ransomware Takedown, APT29...
In this episode of GRXcerpts: Hive Ransomware Takedown Russian-Linked APT29 Malware Breach Notifications Closing the..
Learn More
New Year, More Complex Threat Landscape
Wouldn’t it be nice to start a new year and think to yourself, “THIS will..
Learn More
Do Security Ratings Give a False...
Security ratings are a hot, yet controversial topic. They provide a quantifiable assessment of risk,..
Learn More
Cybersecurity News: ChatGPT Concerns for Cybersecurity,...
As attacks on critical infrastructure have increased around the globe, the US Department of Energy..
Learn More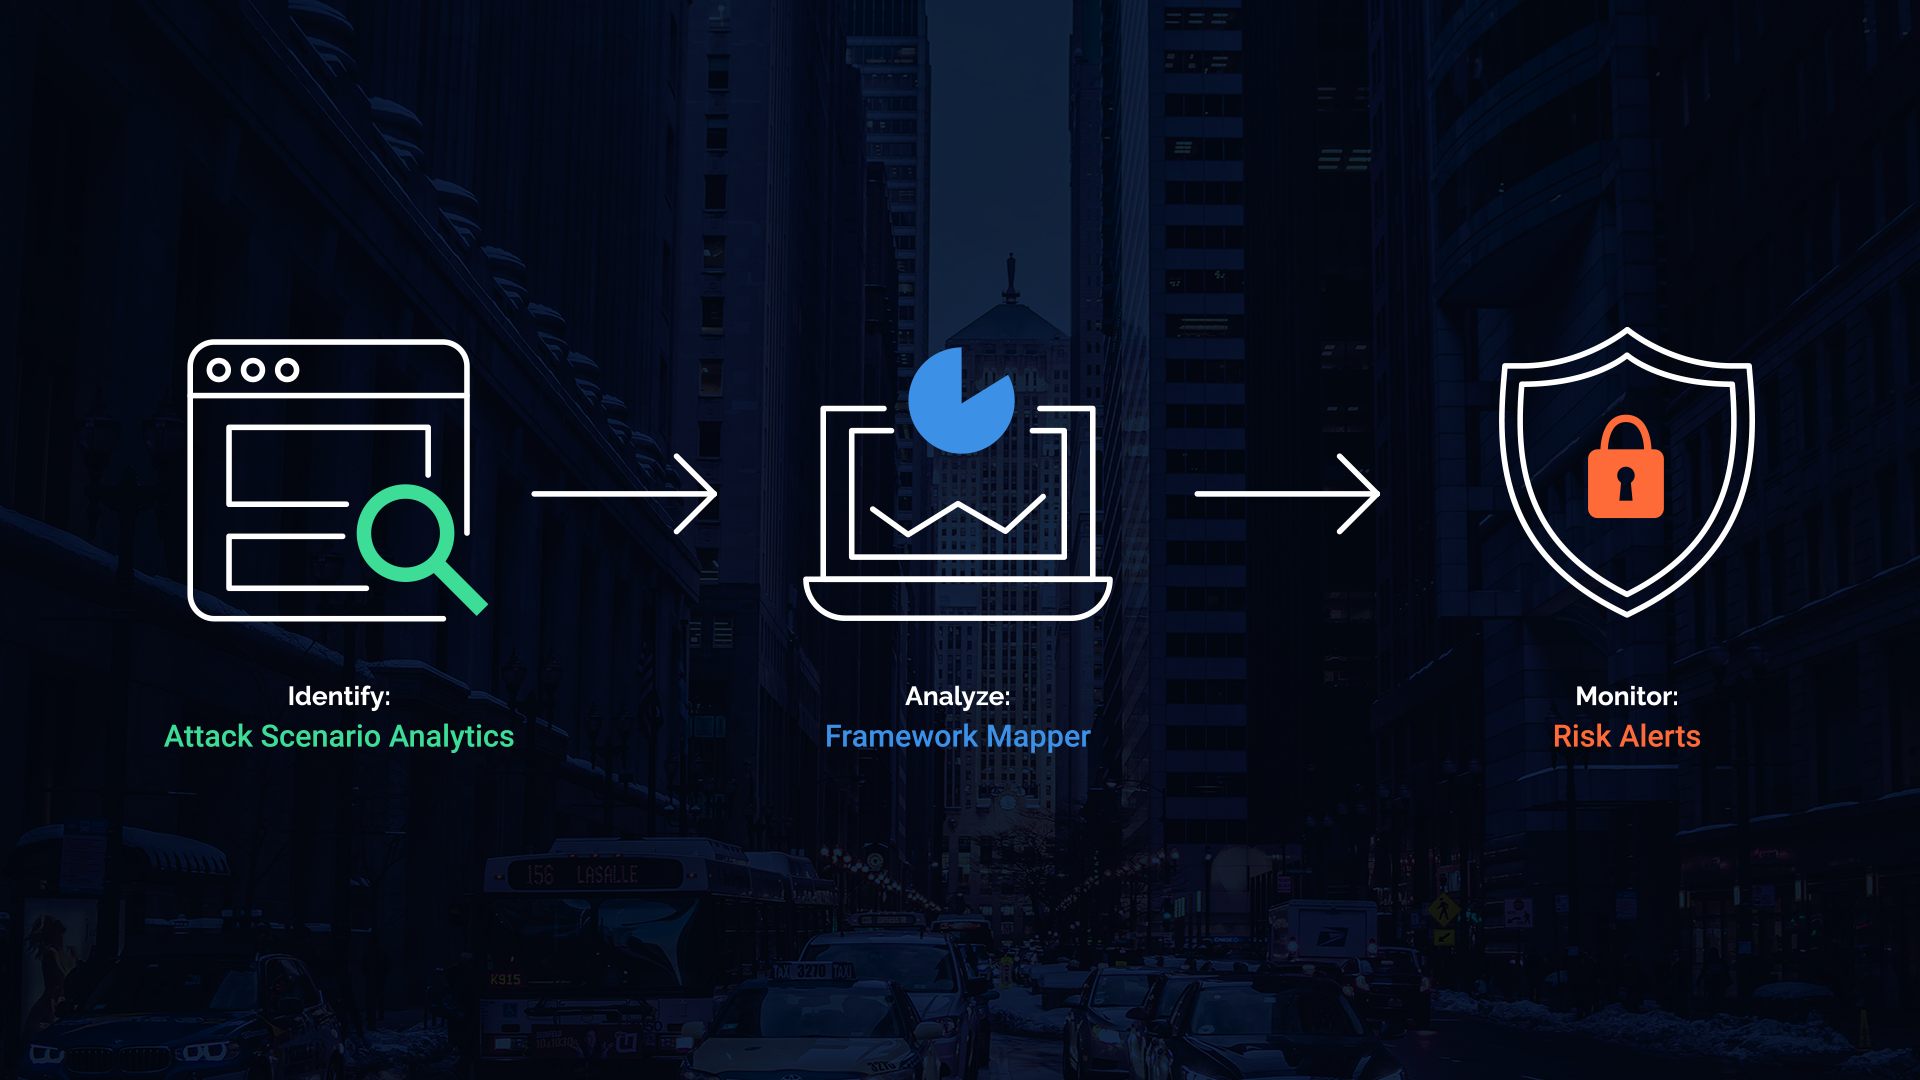
Drive Action Through Third-Party Risk Insights
There are many third-party risk management options on the market, and while some can give..
Learn More
CyberGRX Leverages MITRE Techniques to Uncover...
Denver, CO -- January 18, 2023 – CyberGRX, provider of the world’s first and largest..
Learn More
Properly Scoping Vendor Due Diligence Drives...
Properly Scoping Vendor Due Diligence Saves Both Time and Money One of the costliest mistakes..
Learn More
Security Assessments 2.0: The Next Generation...
The more things change, the more they stay the same. It's a well-worn adage that..
Learn More
Next-Level Strategies for an Efficient Third-Party...
How to Optimize Third-Party Due Diligence for Cybersecurity According to IBM’s Cost of a Data Breach..
Learn More
Don’t Treat Third-Party Risk Management as...
Beyond Basic Compliance: Achieving True Resilience Requires Third-Party Risk and Cybersecurity Alignment Between SOC audits,..
Learn More
Reflections on Cybersecurity Events from 2022...
Hear from CyberGRX staff as they reflect back on the notable cybersecurity events from the..
Learn More
How the Role and Priorities of...
The role of a Chief Information Security Officer (CISO) is changing. While 76% of CISOs..
Learn More
How to Conduct Third-Party Due Diligence
Identifying and engaging with the right partners is essential to the success of most businesses...
Learn More
Cybersecurity News: Cuban Ransomware, Healthcare Vendor...
Trending headlines in cybersecurity: Microsoft Warning for European Organizations Cuban Ransomware Attacks World Cup Phishing..
Learn More
Inherent Risk & Residual Risk...What's the...
You’ve worked hard to develop, implement, and continually improve your cybersecurity program, recognizing your organization..
Learn More
Ho Ho HACKED! Ransomware Awareness for...
‘Tis the season for ransomware awareness because, for hackers, ‘it’s the most wonderful time of..
Learn More
Cybersecurity News: The Impact of our...
Trending headlines in cybersecurity: The 8th Google Zero Day Threat of 2022 An Aggressive Qakbot..
Learn More
How Automated ESG Due Diligence Makes...
Over the past few years, Environmental, Social, and Governance (ESG) regulations have become increasingly rigorous..
Learn More
Keep the Cyber Grinch Out: Holiday...
The holidays are just around the corner– and so are the cyber grinches, waiting for..
Learn More
Cybersecurity News: Mandates for Financial Services,...
Trending headlines in cybersecurity from the week: State of Industrial Cybersecurity New Regulations for Financial..
Learn More
Cybersecurity News: Education Grants, Twitter Phishing...
Trending headlines in cybersecurity from the week: Cybersecurity Clinics Program Act Phishing Caution to Twitter..
Learn More
Cybersecurity News: Twitter Phishing Cautions, Passwordless...
Trending headlines in cybersecurity from the week: Cybersecurity Clinics Program Act Phishing Caution to Twitter..
Learn More
Security Assessments: Waste of Time or...
It’s the million-dollar question: is the juice from security assessments worth the squeeze? We all..
Learn More
What Classic Rock Teaches Us About...
It’s well documented that music generates an emotional response for most people. And there’s actual..
Learn More
Creating a Culture of Security: Best...
We all know zero risk is impossible, but there’s still plenty of room for improvement,..
Learn More
CyberGRX Ranked No. 220 Fastest-Growing Company...
Denver, Co. -- November 16, 2022 -- CyberGRX, provider of the world’s first and largest..
Learn More
New Artificial Intelligence Regulations Will Require...
The frontier is closing on artificial intelligence: Where AI once represented the “Wild West” of..
Learn More
Cybersecurity News: Cyber Insurance, Media Supply...
Trending headlines in cybersecurity from the week: Cyber insurance rates stabilizing and decelerating in 2023..
Learn More
Cybersecurity News: Ransomware Summit, SEC Regulations...
Trending headlines in cybersecurity from the week: The second annual global Ransomware Summit Changes to..
Learn More
Diaxin Ransomware, Windows Zero-Day Threat, 6G...
In this episode of GRXcerpts, we keep you updated on interesting and trending headlines in..
Learn More
CyberGRX Spotlighted in TAG Cyber Analysis...
Denver – October 18, 2022 – CyberGRX, provider of the world’s first and largest global..
Learn More
Budgeting for Your TPRM Program
With two consecutive drops in real GDP in 2022, 1.6% and 0.9% for the first..
Learn More
Deepfakes, Zoom High-Priority Patch, Authentication Updates
Welcome to GRXcerpts, highlighting interesting and trending headlines in cybersecurity. Stay informed in less than..
Learn More
Security Shift: From Cyber Threat Intelligence...
The traditional approach to cybersecurity is broken. Data tells the tale: Despite the development and..
Learn More
Checklist: TPRM Budget Preparation
Download Now Considerations to assist in preparing for your annual third-party risk management (TPRM) budget..
Learn More

What Cyber Risk Isn’t Third-Party Risk?
We thought 2021 was a record-breaking year for cyberattacks. And it was. Compared to 2020,..
Learn More
CyberGRX Named Winner in ‘Threat Intelligence...
DENVER - Oct. 6, 2022 – CyberGRX, provider of the world’s first and largest global..
Learn More
Trust: A Hidden (Yet Valuable) Benefit...
Trust is one of the most powerful currencies in business, but it’s hard to earn..
Learn More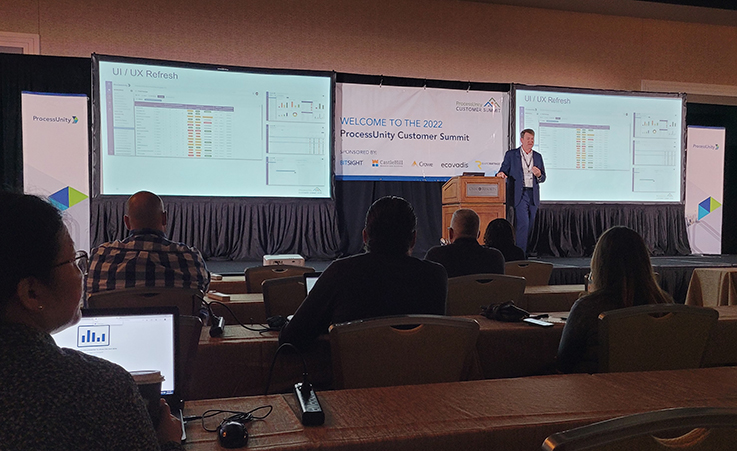
ProcessUnity Customer Summit: Experts Advocate for...
At the 2022 ProcessUnity Customer Summit, experts from a variety of industries and organizations convened..
Learn More
10 Ways to Make your TPCRM...
It seems that not a week goes by without a data breach or some other..
Learn More
CyberGRX Recognized with Frost & Sullivan’s...
Denver, CO -- September 27, 2022 – CyberGRX, provider of the world’s first and largest..
Learn More
The 4 Essential Pillars of a...
Toyota’s factories, which pump out over 10 million vehicles every year, screeched to a halt..
Learn More
If Total Risk Elimination is Impossible,...
Zero isn't possible. No matter how much money you spend on cybersecurity, how many people..
Learn More
Infographic: The Dark Side of Digital...
According to Tech Pro Research, 70% of organizations either have or are working on a..
Learn More
Evolving TPCRM with a Data-Driven Approach
Likely no one in our industry will dispute the traditional approach to third-party cyber risk..
Learn More
5 Tips for CISOs About the...
To quote Bob Dylan, "the times, they are a-changin'." A decade ago, all eyes were..
Learn More
Evaluating Security Risk When Onboarding New...
In today’s tightly interwoven supply chains and highly competitive markets, organizations must continuously evaluate and..
Learn More
Accelerating Machine Learning Pipelines with AWS...
"Work it harder, make it better. Do it faster, makes us stronger. More than ever,..
Learn More
How Risk Managers Are Reducing Enterprise...
“Take calculated risks. That is quite different from being rash.” These words of wisdom from..
Learn More
Third-Party Risk Assessments: Are They Effective...
It’s the million dollar question every cybersecurity practitioner has in the back of their minds…do..
Learn More
The Human Impact of a Cyber...
News flash! Headlines about cyber attacks don’t tell the whole story. The world is in..
Learn More
Which Cybersecurity Certification Does Your Business...
More customer wins. Better organizational security. Efficient compliance management. These are just a few of..
Learn More
Why You Need Continuous Monitoring of...
Working with a third-party vendor is a lot like inviting someone into your home during..
Learn More
3 Business Benefits of a Cybersecurity...
Cyber risk is a top concern for businesses today thanks to the ubiquity of the..
Learn More
How Does Third-Party Risk Fit Into...
In today’s digital economy, it’s rare to find an enterprise or corporation that manages every..
Learn More
RSA Conference 2022: Transformation, TPCRM, and...
What. An. Event! Imagine…26,000 cybersecurity professionals learning and networking IRL for the first time since..
Learn More
GRC 20/20 Quantifies Return on Investment...
Independent research examines the measurable benefits of ProcessUnity VRM Imagine what business results you could..
Learn More
Zero Trust as a Third-Party Risk...
According to a Microsoft survey, more than 40% of workers are considering quitting their jobs..
Learn More
CyberGRX Use Case Guide
CyberGRX is the Cyber Risk Intelligence industry leader. Within the CyberGRX Exchange, we have an..
Learn More
CyberGRX Named Winner In 10th Annual...
CyberGRX recognized as Hot Company in the Third-Party Cyber Risk Management (TPCRM) category for its..
Learn More
CyberGRX and Google Cloud Collaborate to...
Google Cloud to satisfy risk and procurement needs across wide customer base and deliver a..
Learn More
How a Data-Driven Approach to TPCRM...
When it comes to TPRCM (Third-Party Cyber Risk Management), the scope of potential threats outside..
Learn More
How an Exchange Supports an Effective...
According to a recent report by Deloitte, organizations spend 10.9% of their IT budgets on..
Learn More
Building a TPCRM Program: Where to...
Today's organizations have become increasingly reliant on third-party vendors to help them grow and sustain..
Learn More
How Common Are Third-Party Security Breaches?
In terms of operational agility and cybersecurity, third-party service providers can be a double-edged..
Learn More
Cyberattacks and Breaches can Severely Damage...
Cybercriminals want your data and they don’t care about the fallout for your organization. The..
Learn More
CyberGRX recognized by EMA as a...
We are proud to announce that CyberGRX has been named as one of the top..
Learn More
3 Questions Healthcare Organizations Should Consider...
Did you know that 33% of third-party data breaches in 2021 targeted healthcare organizations? In..
Learn More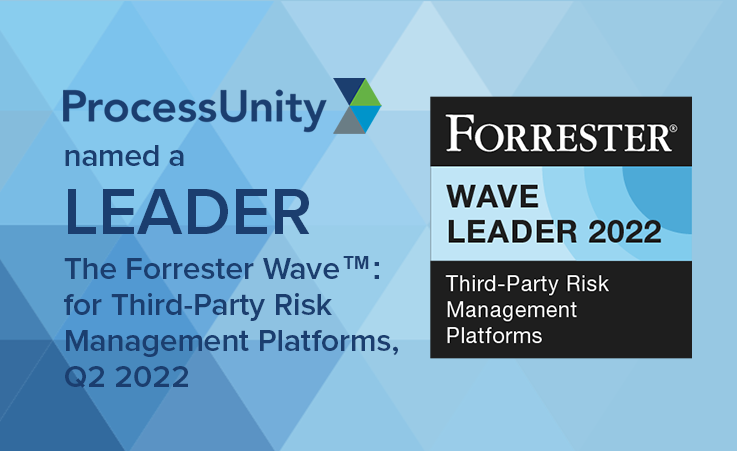
ProcessUnity is a Leader in the...
The results are in: ProcessUnity is a Leader in The Forrester Wave™: Third-Party Risk Management..
Learn More
Can You Apply Zero-Trust to Your...
The federal government shifted to a zero-trust strategy in 2022 to bolster its cybersecurity posture; private..
Learn More
CyberGRX Redefines Third Party Cyber Risk...
Company experiences three-digit customer and revenue growth in Q1 alone; brings first-of-its-kind features to market..
Learn More
The ONE Thing All Modern Third-Party...
At CyberGRX, we’re fortunate to engage with the brightest minds in the third-party cyber risk..
Learn More
Managing the Security Risks in Third-Party...
While the average cost of a data breach, $3.86 million, is alarming, another statistic also..
Learn More
Why Third-Party Risk Management Saves Businesses...
Small to midsize companies are increasingly feeling financial pressure on their operations. According to Harvard..
Learn More
How Remote Work Has Changed On-Site...
The pandemic caused a shift in how we think about the modern workplace. Pew Research found that..
Learn More
Are Your Suppliers Putting You at...
Global events, such as the Ukraine-Russia conflict, are driving increased risk levels in nearly every..
Learn More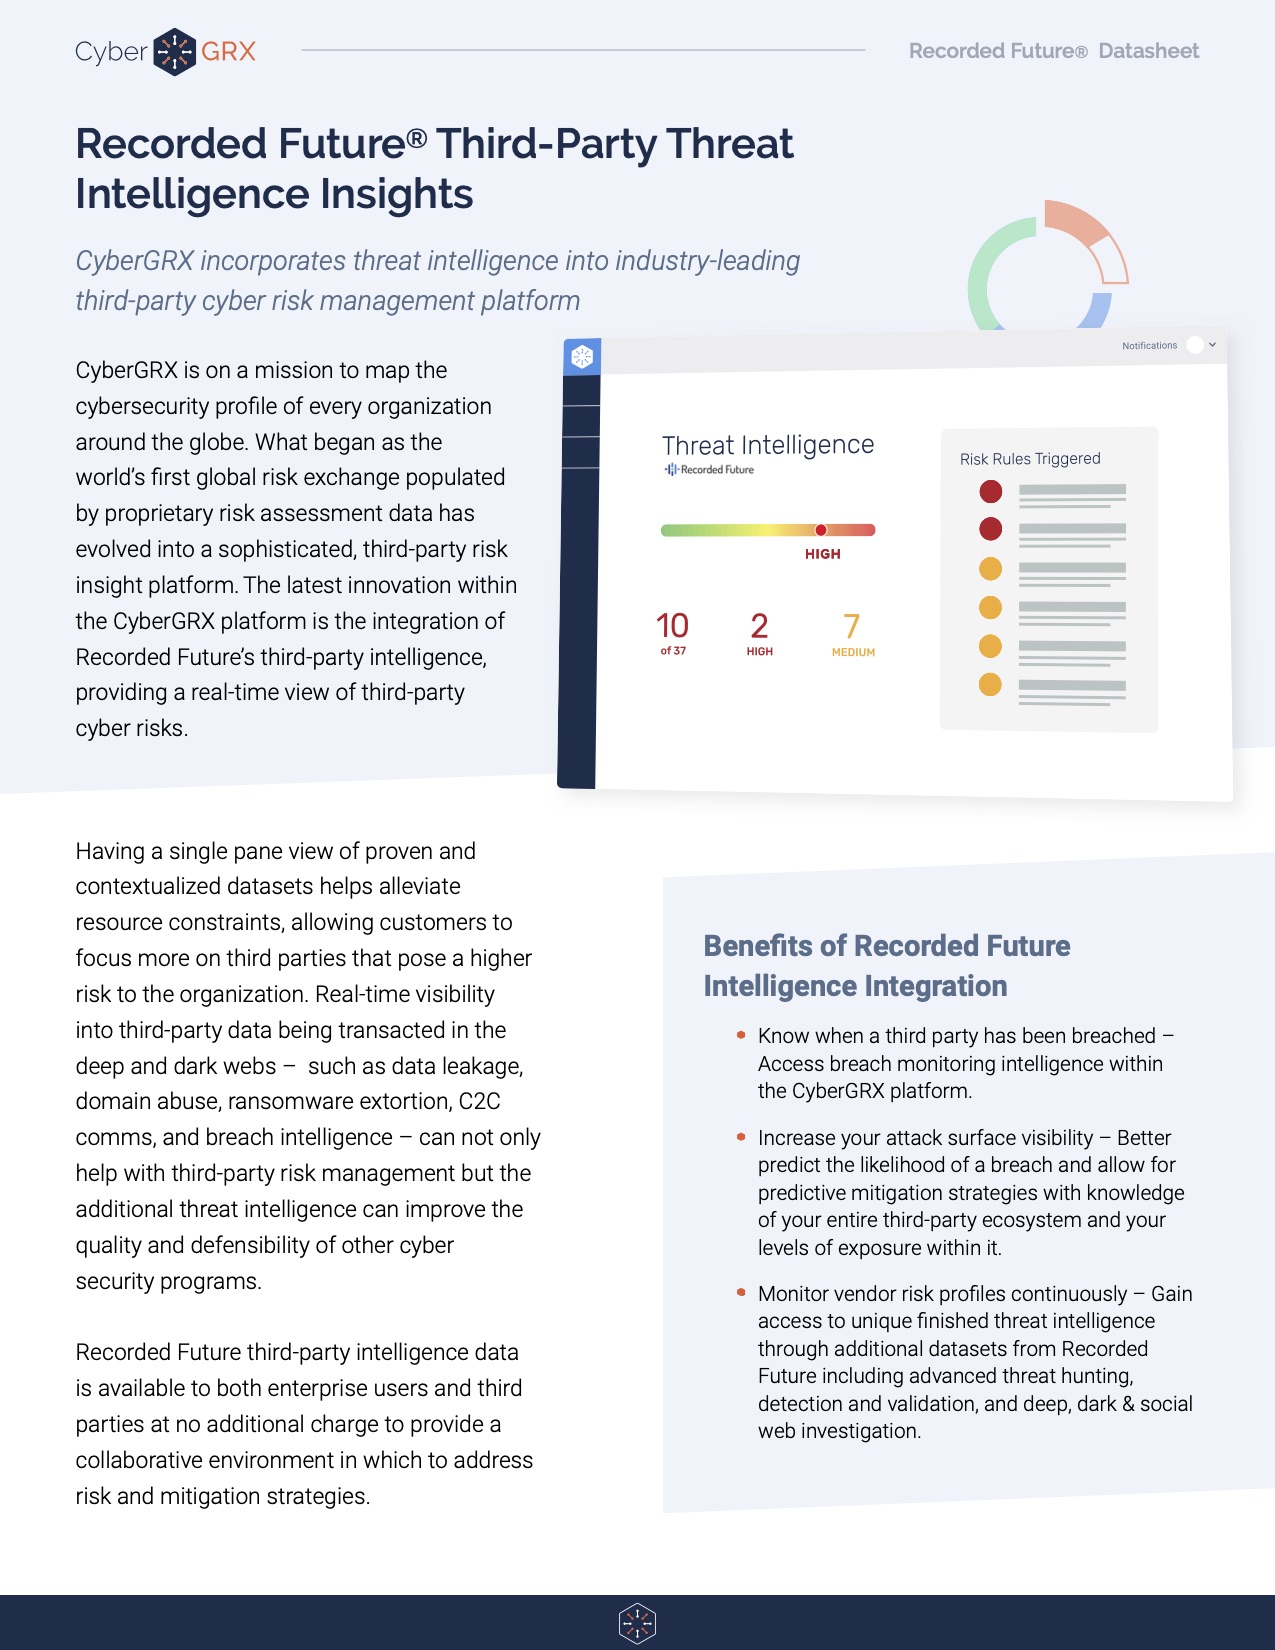
Recorded Future Third-Party Threat Intelligence Insights
Having a single pane view of proven and contextualized datasets helps alleviate resource constraints, allowing..
Learn More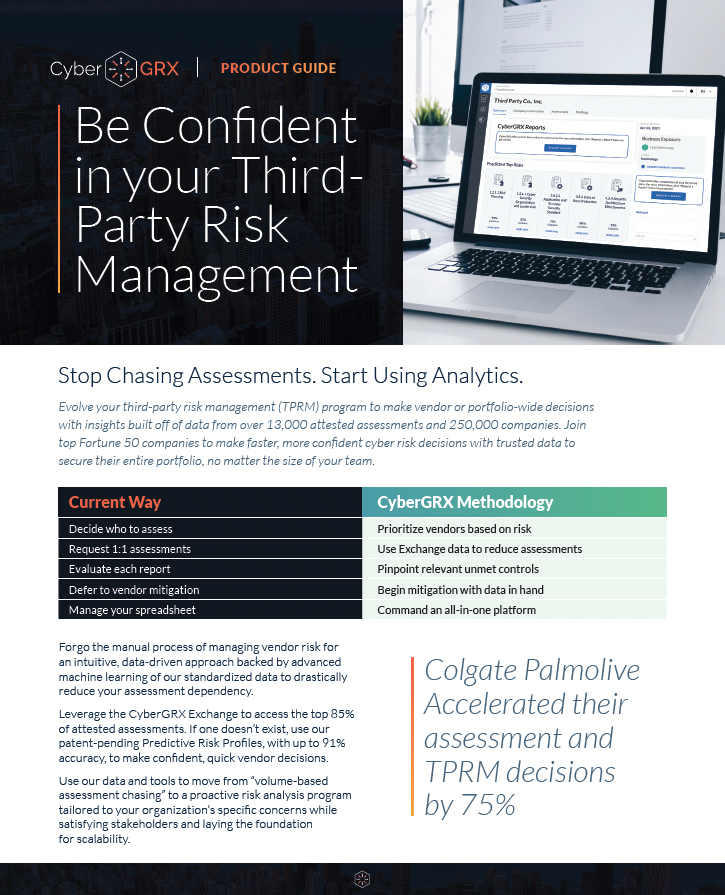
CyberGRX Product Guide
CyberGRX brings a revolutionary approach to third-party cyber risk management. Using sophisticated data analytics, real-world..
Learn More
3 Third-Party Risk Lessons from the...
Proactively mitigate third-party risks with vendor engagement and issue response strategies Lapsus$, a criminal hacking..
Learn More
The 6 Most Common Third-Party Security...
Businesses today are increasingly reliant on third-party vendors to help them run their operations. These..
Learn More
Protecting Your Network From the Increased...
By the start of 2022, about 30% of all employees in the U.S. were working..
Learn More
Why You Need Total Transparency with...
Cybercriminals know only too well how lucrative targeting third parties can be. They have honed..
Learn More
Social Engineering: How to Not Be...
Remember the time you received a phone call from a disgruntled customer or employee that..
Learn More
Leveraging Predictive Risk Profiles for Greater...
With cyber-attacks escalating daily and a constant flow of headlines about ransomware demands bringing supply..
Learn More
Understanding Your Cybersecurity Risks During the...
Cybersecurity experts warn that conflict in Ukraine presents ‘perhaps the most acute cyber risk U.S...
Learn More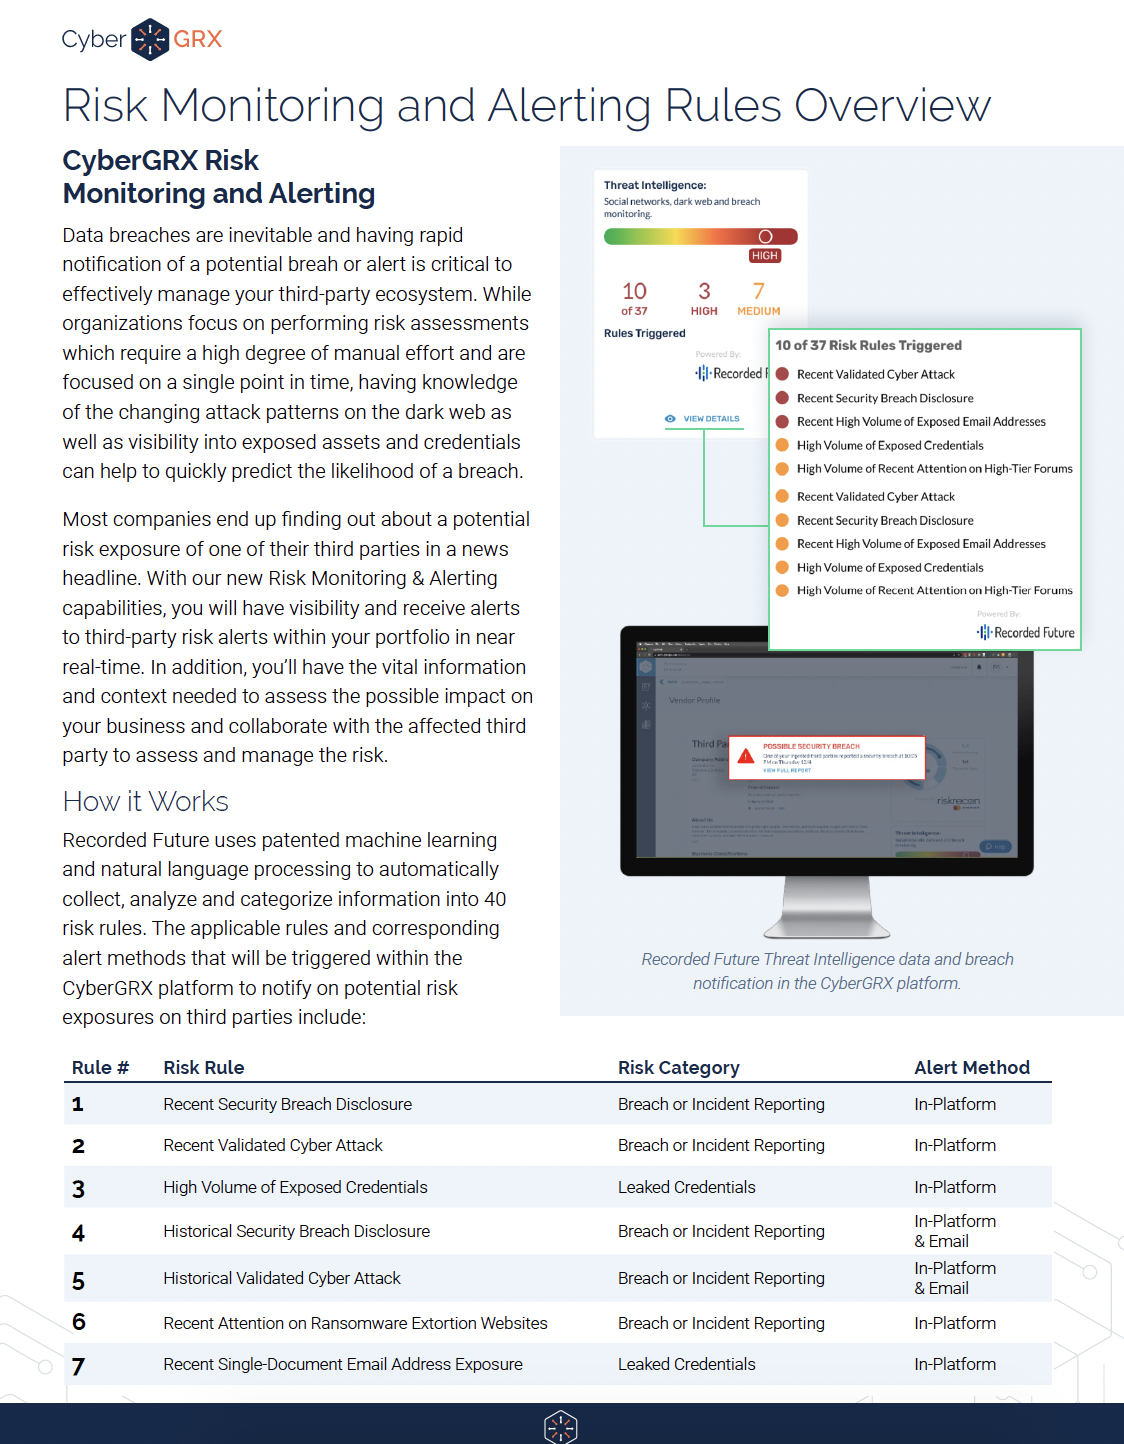
War in Ukraine: Monitoring Resiliency in...
As the world turns its attention towards the escalating conflict between Russia and Ukraine, companies..
Learn More
5 Areas to Mitigate Risk in...
If you work within a Vendor Risk Management (VRM) team, you know that third-party risk..
Learn More
Beyond Risk Management: How Cyber Risk...
Definitions of the word intelligence include a collection of information of military or political value..
Learn More
Are You Ready for the PRA's...
The clock's ticking. If you're a financial services institution regulated by the Prudential Regulatory Authority,..
Learn More
Why Retailers Need Cyber Risk Intelligence...
The retail industry is one of the biggest contributors to the Gross Domestic Product (GDP)..
Learn More
How to Improve Your Vendor Due...
You can't do business without your vendors. They support critical elements of your organization, from..
Learn More
Building Your Intelligent Risk Portfolio
Companies increasingly rely on third parties to do business. With this, comes an increased vulnerability..
Learn More
3 Reasons to Align Cybersecurity and...
In the face of increasingly common and costly data breaches, your organization needs to know how..
Learn More
Log4j: How Organizations Address Cybersecurity with...
The discovery of the Log4j vulnerability is the latest incident to send organizations into panic about..
Learn More
Log4j Vulnerability: A Lesson in Third...
A vulnerability was recently detected in Log4j, an open-source logging framework web developers use to..
Learn More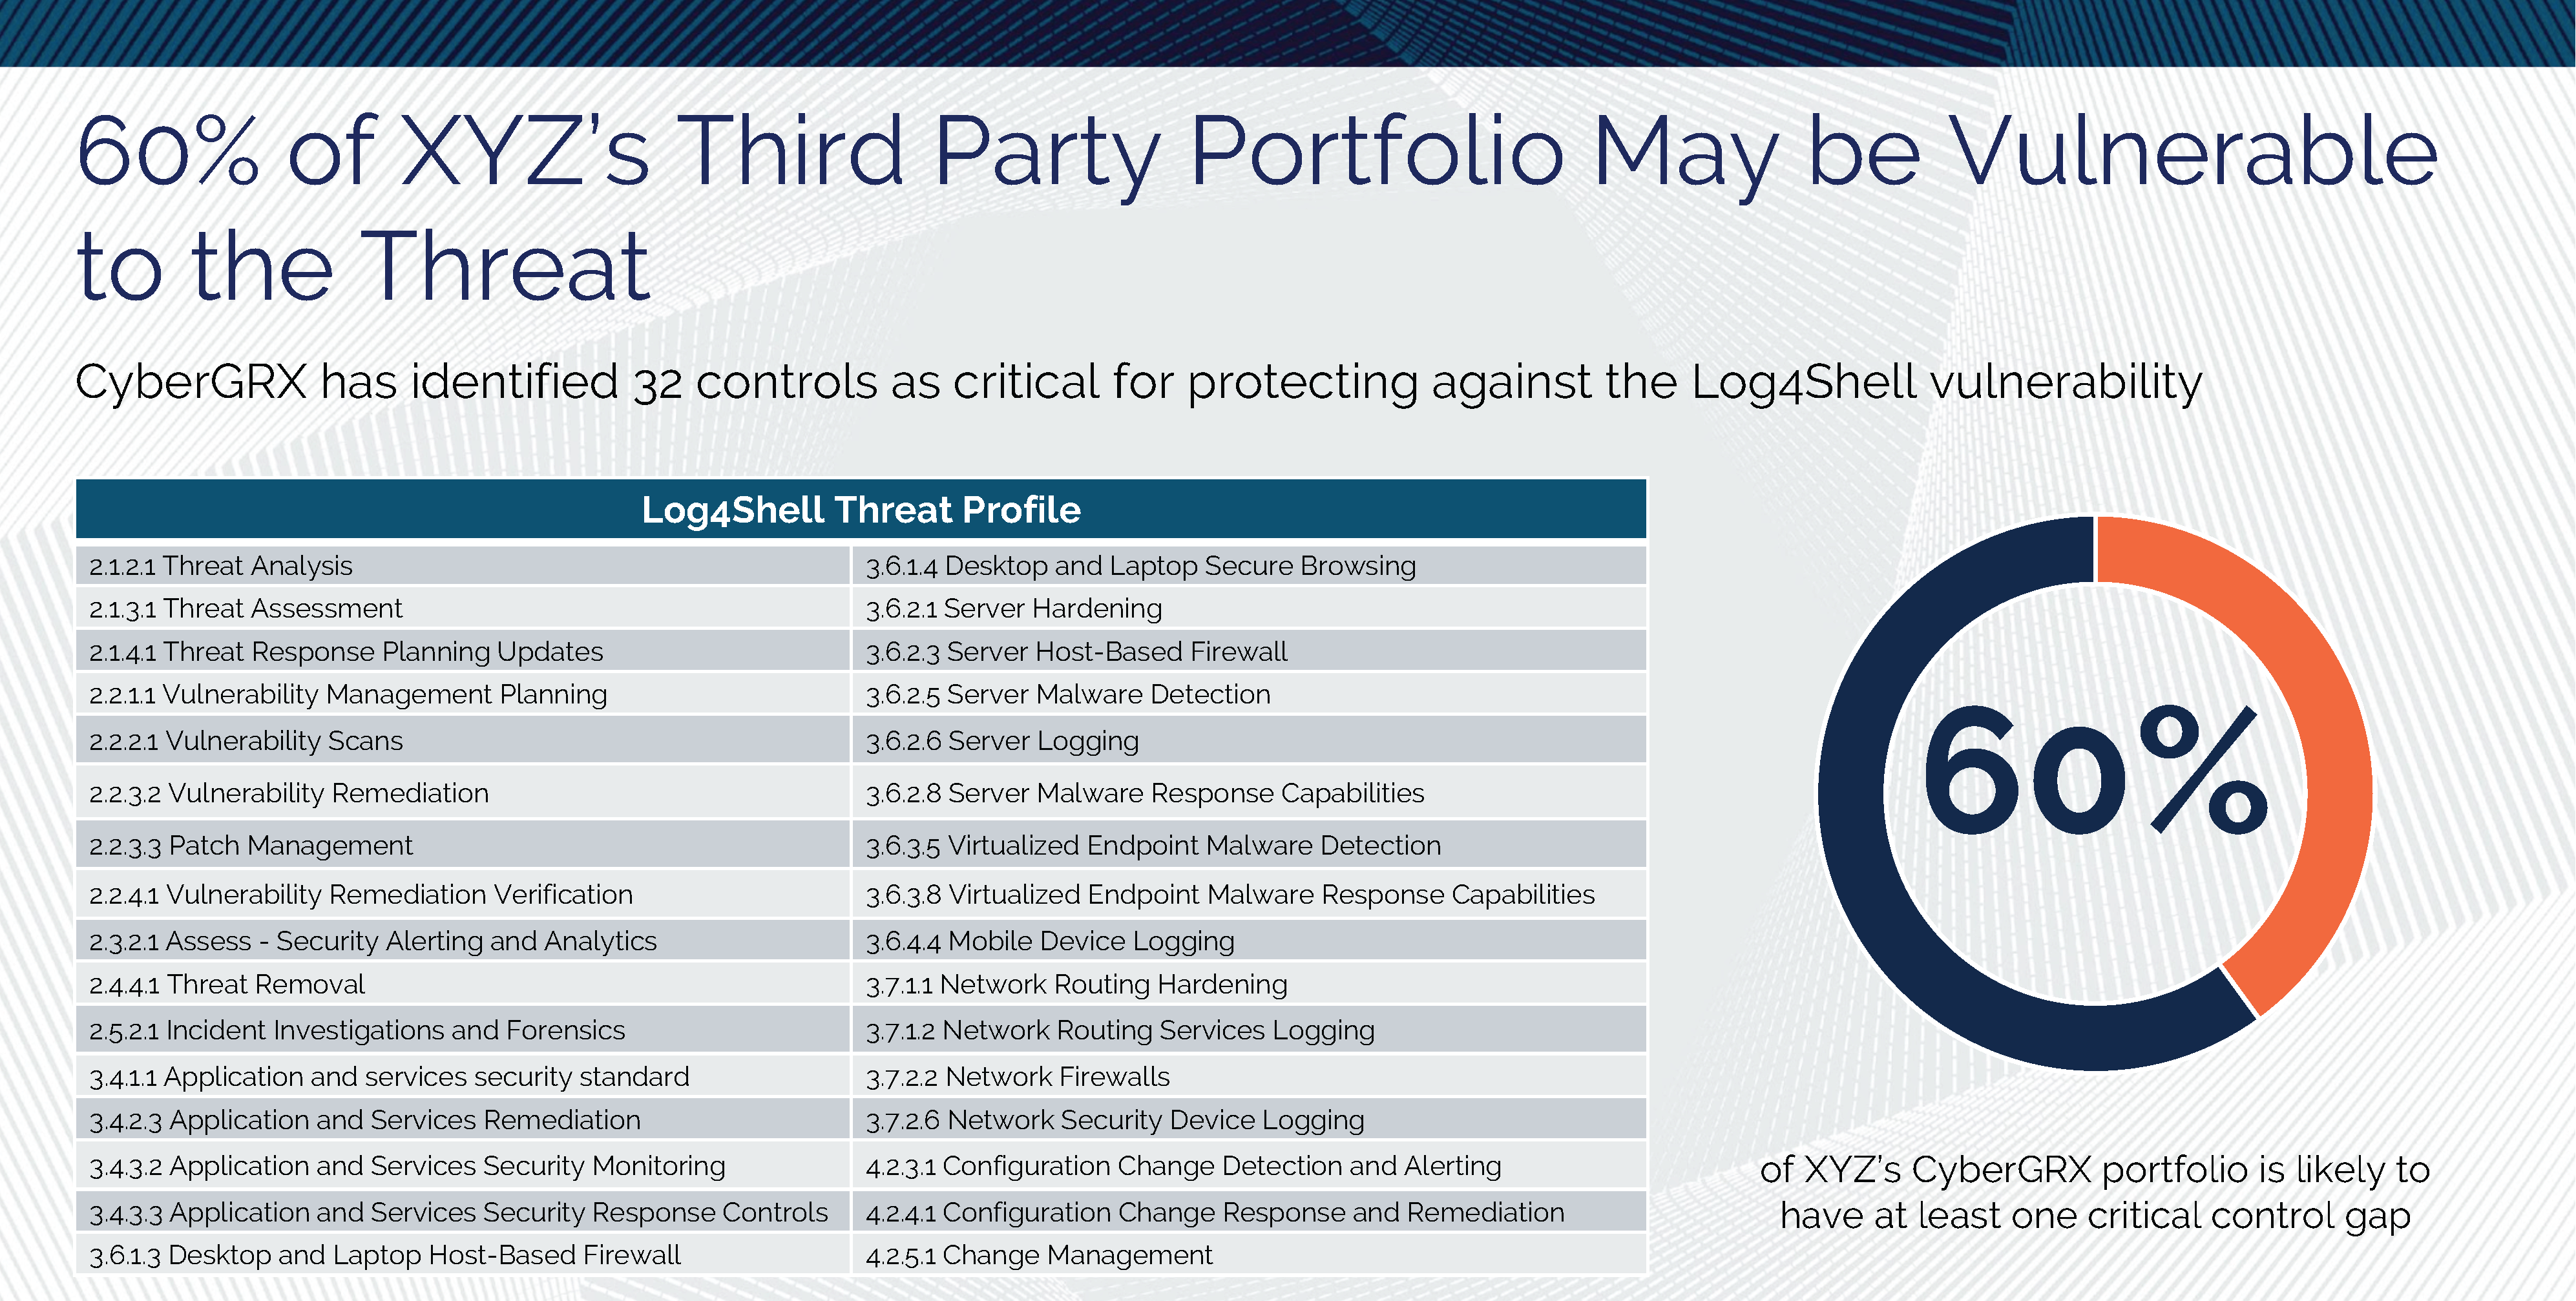
Log4Shell and Threat Profiles
The Log4Shell attack has shown, once again, how important it is to know the cybersecurity postures..
Learn More
Log4Shell and Third-Party Vendors: How Will...
With the whole world losing their marbles over the Apache Log4Shell vulnerability (and rightfully so),..
Learn More
The Difference Between Third-Party Cyber Risk...
Major security incidents have shed light on the cyber risks associated with third-party suppliers and..
Learn More
How To Create a Results-Driven Supplier...
Seventy percent of organizations have under-invested in their supplier risk assessments. This fact is startling given the growing reliance organizations have on..
Learn More
2021 and Beyond: Financial Viability Trends...
Experts from ProcessUnity and RapidRatings recently got together to discuss why world-class third-party risk management programs are leveraging financial health ratings for onboarding, due..
Learn More
5 Easy Ways to Increase Your...
We want all members of our exchange to leverage their completed CyberGRX assessment as their..
Learn More
How Predictive Analytics Will Keep You...
The GDPR Threat With the Information Commissioner's Office's (ICO) ever increasingly active enforcement of the..
Learn More
4 Reasons to Manage Cybersecurity Controls...
The modern cybersecurity program faces more challenges today than ever before. New worldwide directives and increased cyberattacks put pressure..
Learn More
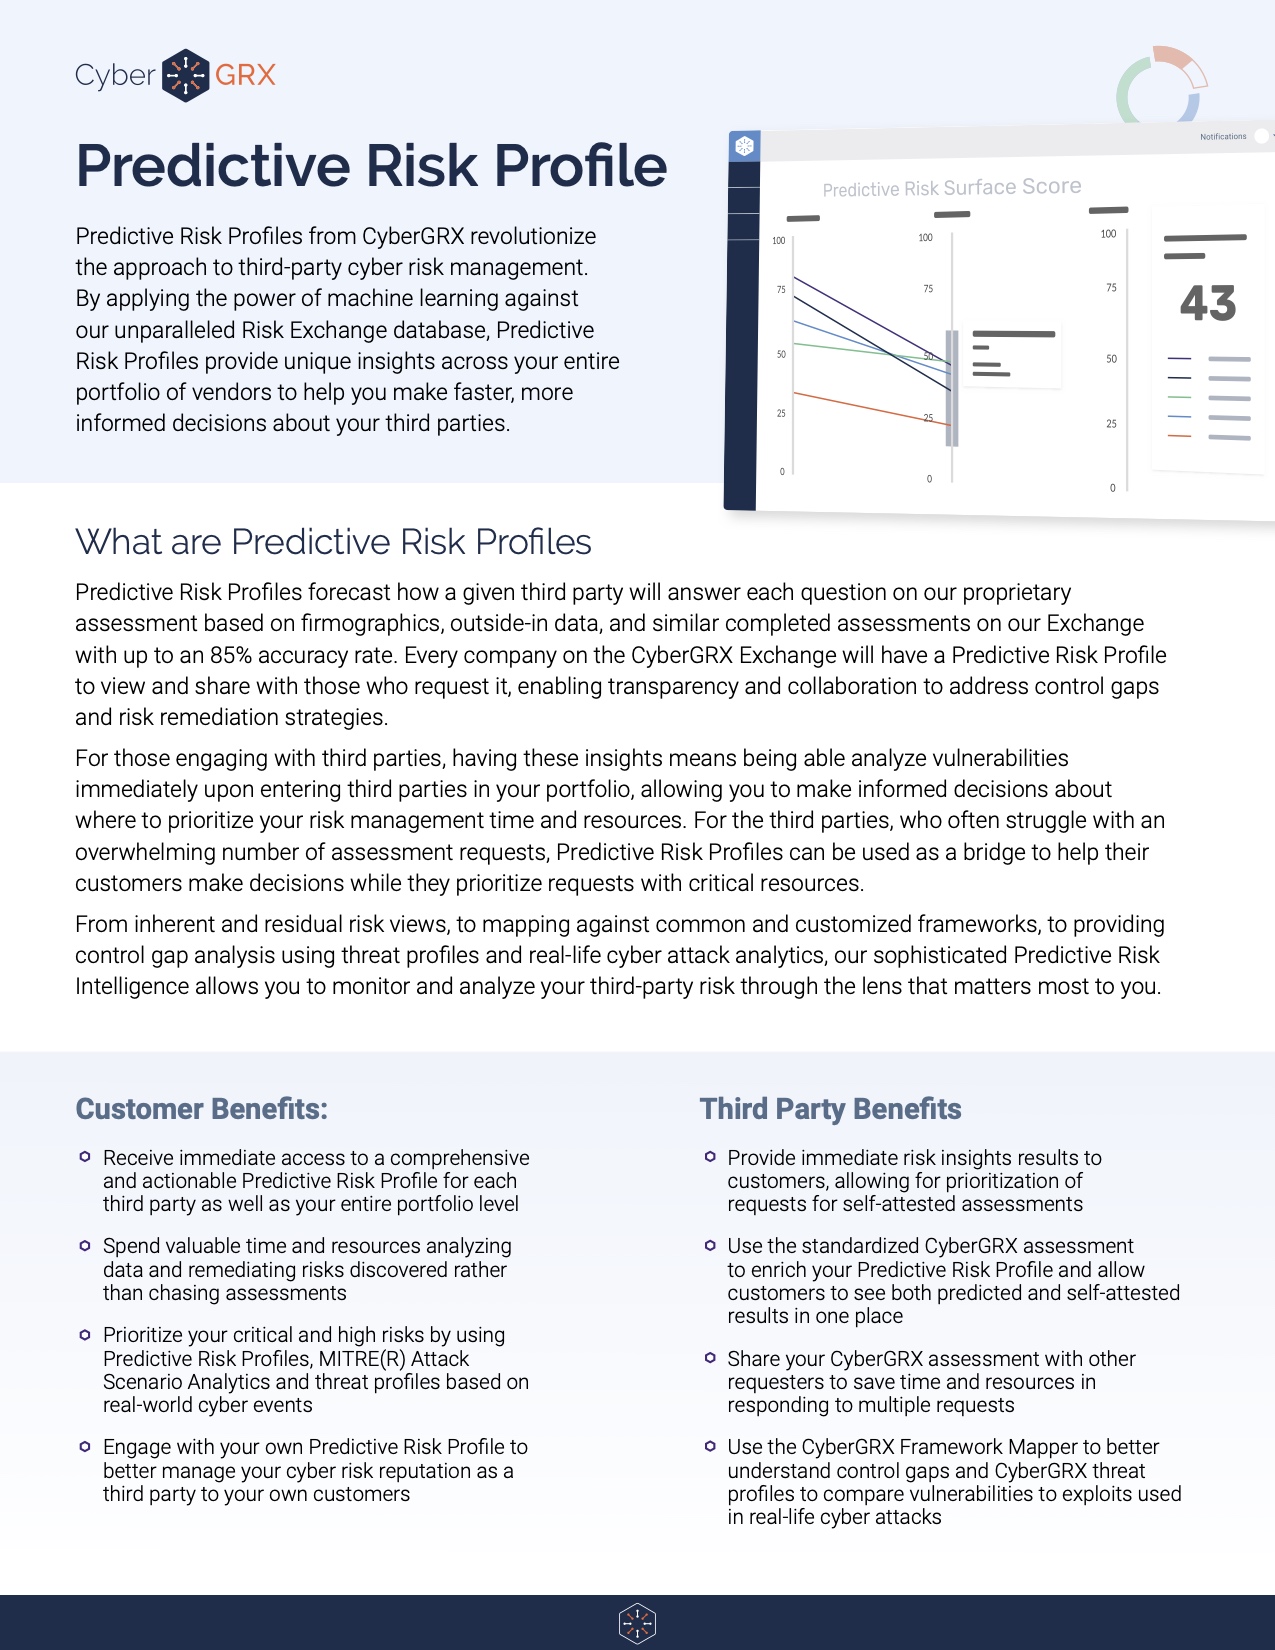
Predictive Risk Profiles Data Sheet
Predictive Risk Profiles from CyberGRX revolutionize the approach to third-party cyber risk management. By applying..
Learn More
5 Tips to Improve Your Vendor...
Vendor due diligence is essential to any third-party risk management program. However, no two due diligence processes are..
Learn More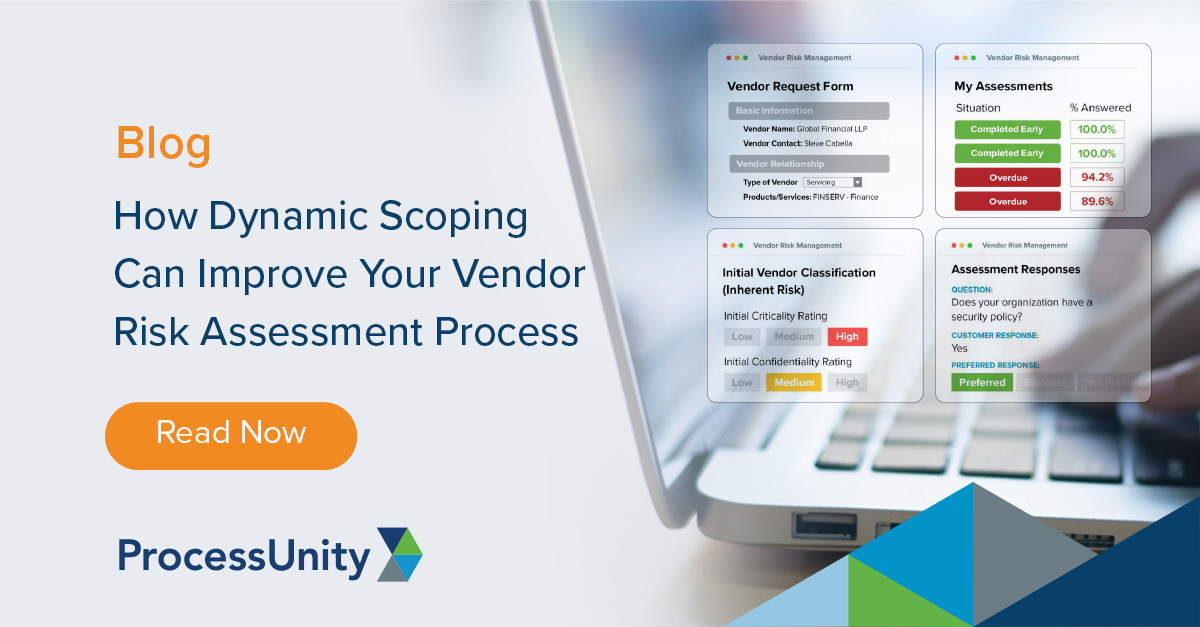
How Dynamic Scoping Can Improve Your...
Vendor risk assessments help third-party risk management (TPRM) teams understand the risk their third parties,..
Learn More
Third-Party Vendor Risk Management Challenges for...
Today’s financial institutions face an incredible challenge when it comes to managing their third-party vendor..
Learn More
Build a Better Vendor Due Diligence...
Take a deep dive into vendor due diligence with ProcessUnity’s in-house due diligence specialist, James Goncalves. This interview..
Learn More
3 Steps to Better Vendor Risk...
Creating and distributing vendor risk assessments is a key part of any third-party risk management program. As organizations utilize third-party services to..
Learn More
Expert Interview: Continuous Monitoring of Third-Party...
ProcessUnity discusses best practices for continuous monitoring of third-party vendor risk with BitSight, a leading..
Learn More
Managing Third-Party Cyber Risk
Each day organizations face new threats that jeopardize their critical networks. Standard cybersecurity practices help mitigate the..
Learn More
Why Organizations Automate Vendor Risk Assessments
It’s a fact increasingly validated with each third-party data breach: when an organization brings on..
Learn More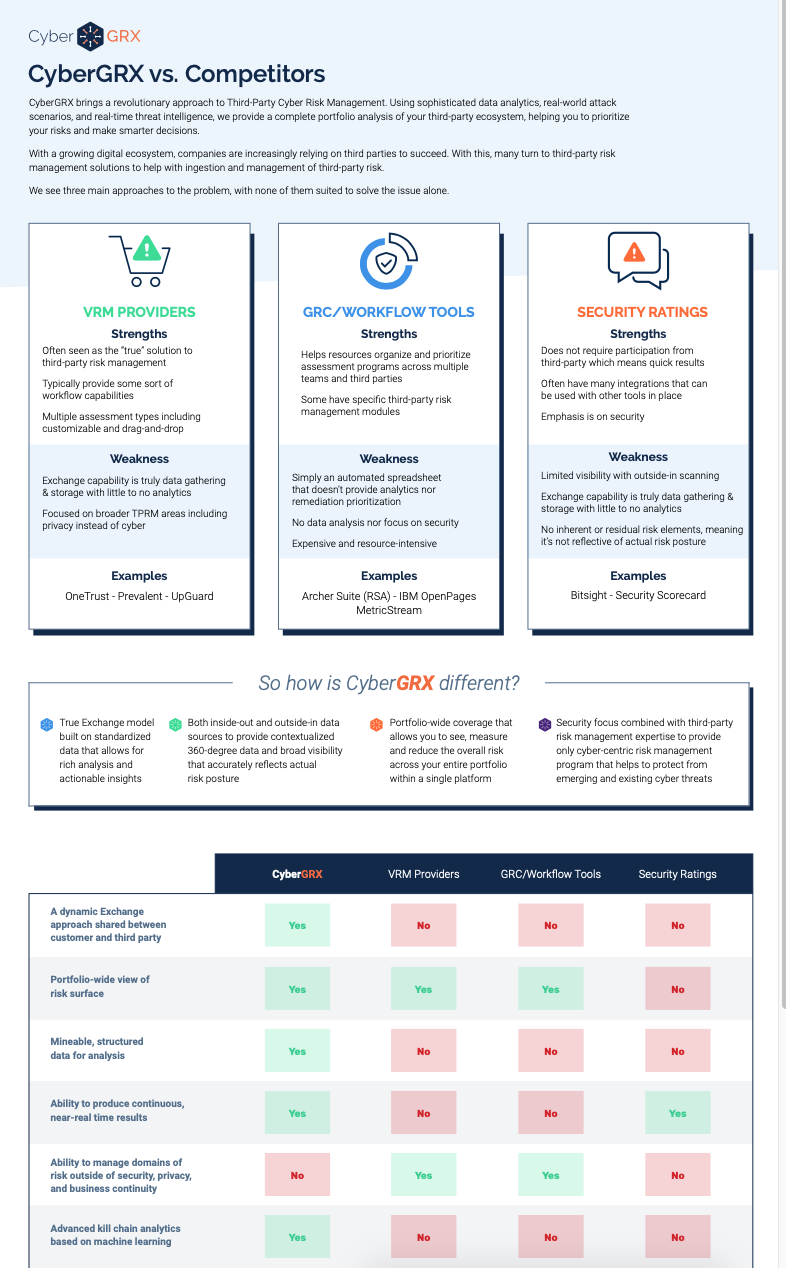
CyberGRX vs. Competitors: A Comparison Chart
Selecting an effective TPCRM program can be a daunting task. While there may be similarities..
Learn More
Inherent Risk vs. Residual Risk in...
Conducting a thorough vendor risk analysis is an integral step in Vendor Risk Management. However,..
Learn More
ProcessUnity Team Kicks Off National Day...
On August 20th, 2021, ProcessUnity hosted its inaugural Day of Giving to provide our team with the..
Learn More
UK PRA Guidelines: New Strategies for...
It goes without saying that operational resiliency and supplier risk management go hand in hand. Organizations need to adapt, respond to, and..
Learn More
What the Biden Administration's Executive Order...
The Biden Administration is prioritizing the nation’s cybersecurity with an executive order to modernize cybersecurity defenses and protect..
Learn More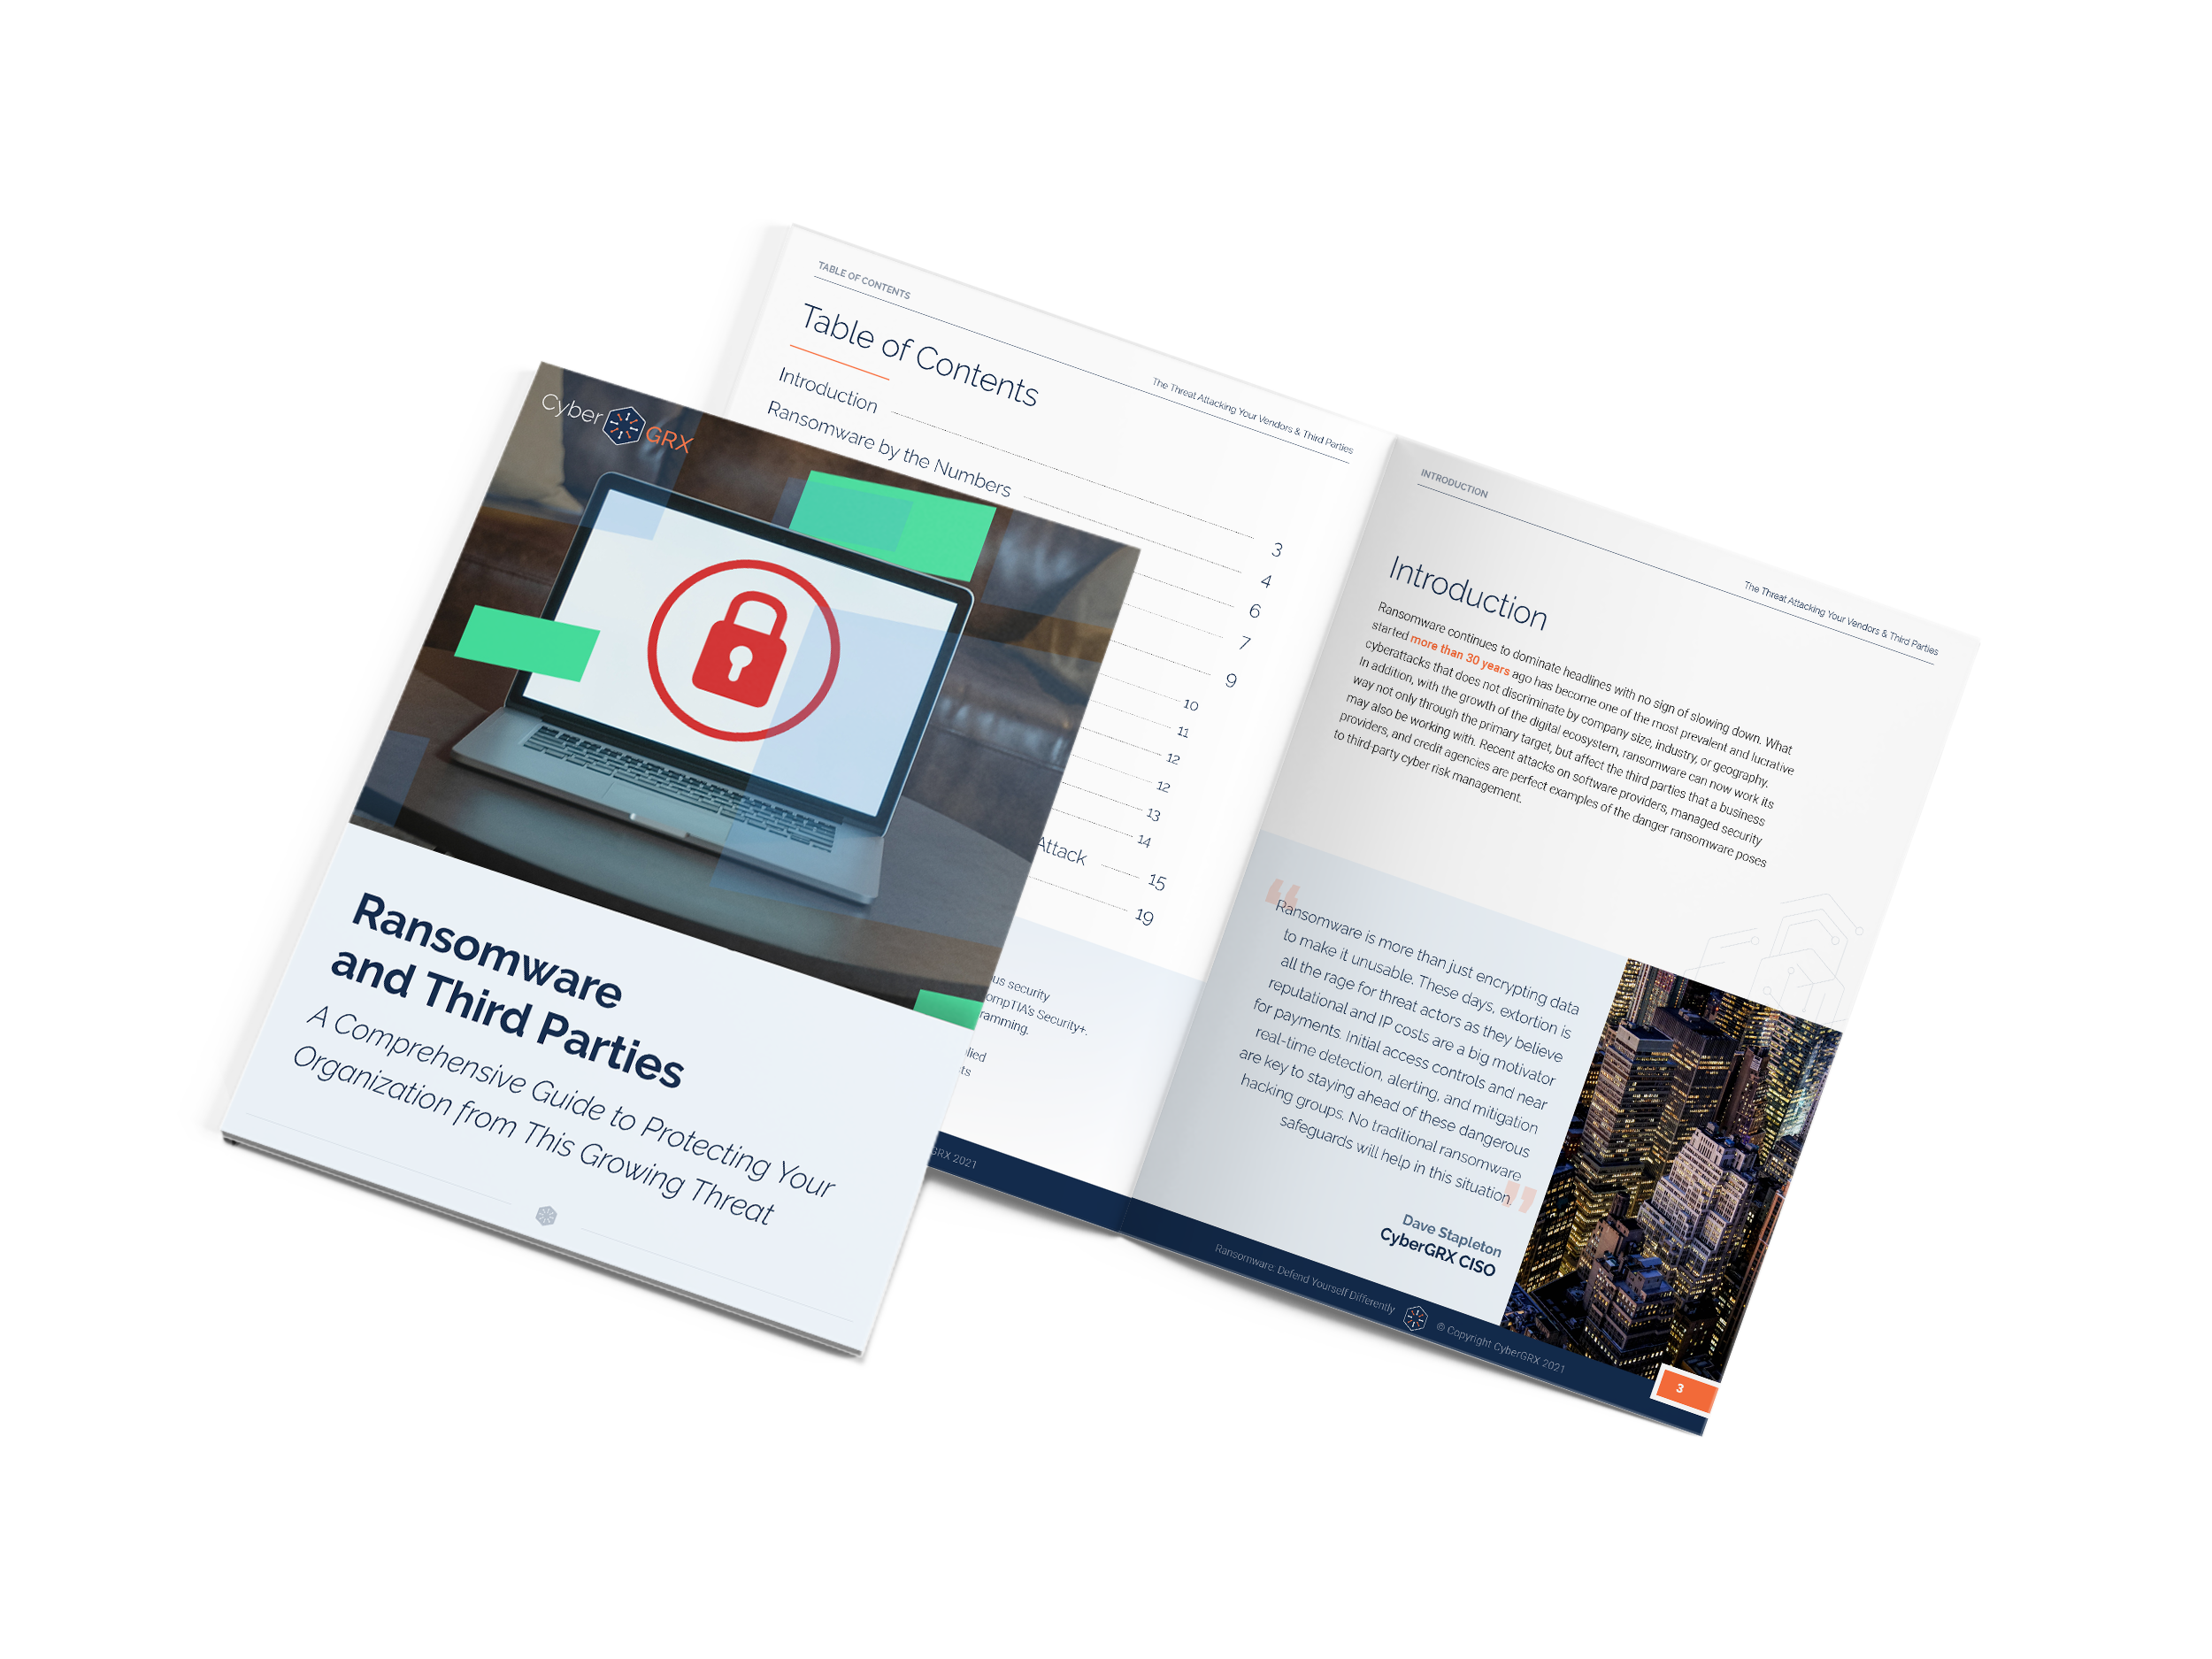
Ransomware & Your Third Parties: A...
Ransomware continues to dominate headlines with no sign of slowing down. What started more than..
Learn More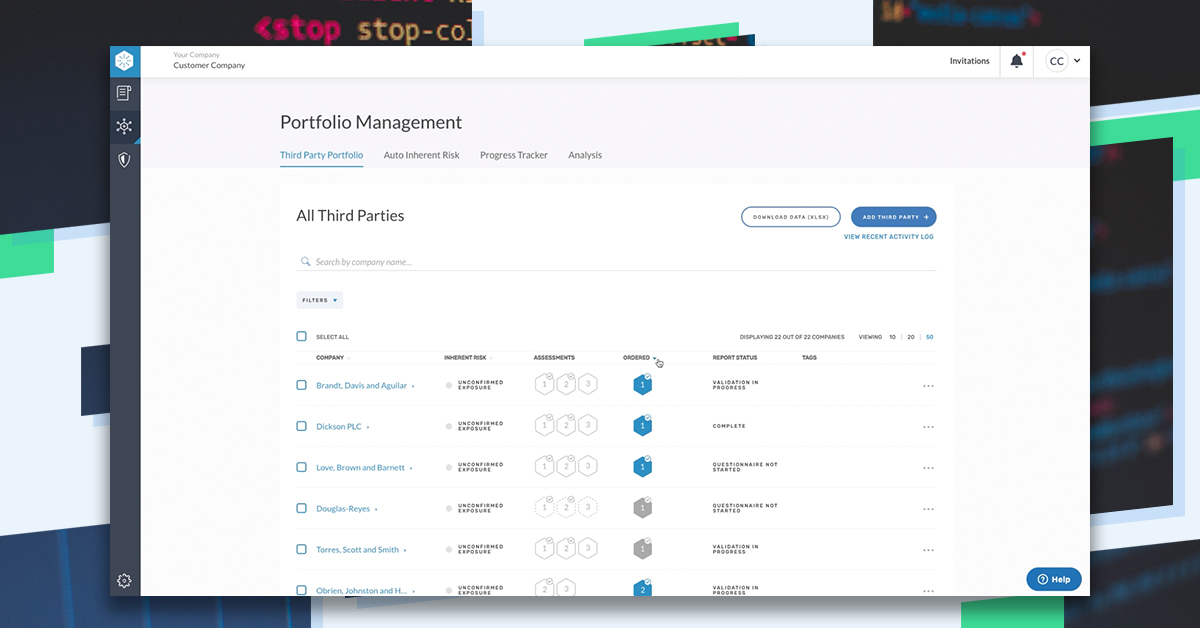
Introducing Enhanced Portfolio Management Features
We know that successful third-party cyber risk management requires a collaborative, comprehensive approach. With three..
Learn More
How to Create a Mature Third-Party...
Whether building a program from scratch or improving an existing program, third-party risk management (TPRM)..
Learn More
ESG Reporting Mandates to Know for...
Third-Party Risk Management in today’s regulatory landscape is difficult – and it is about to..
Learn More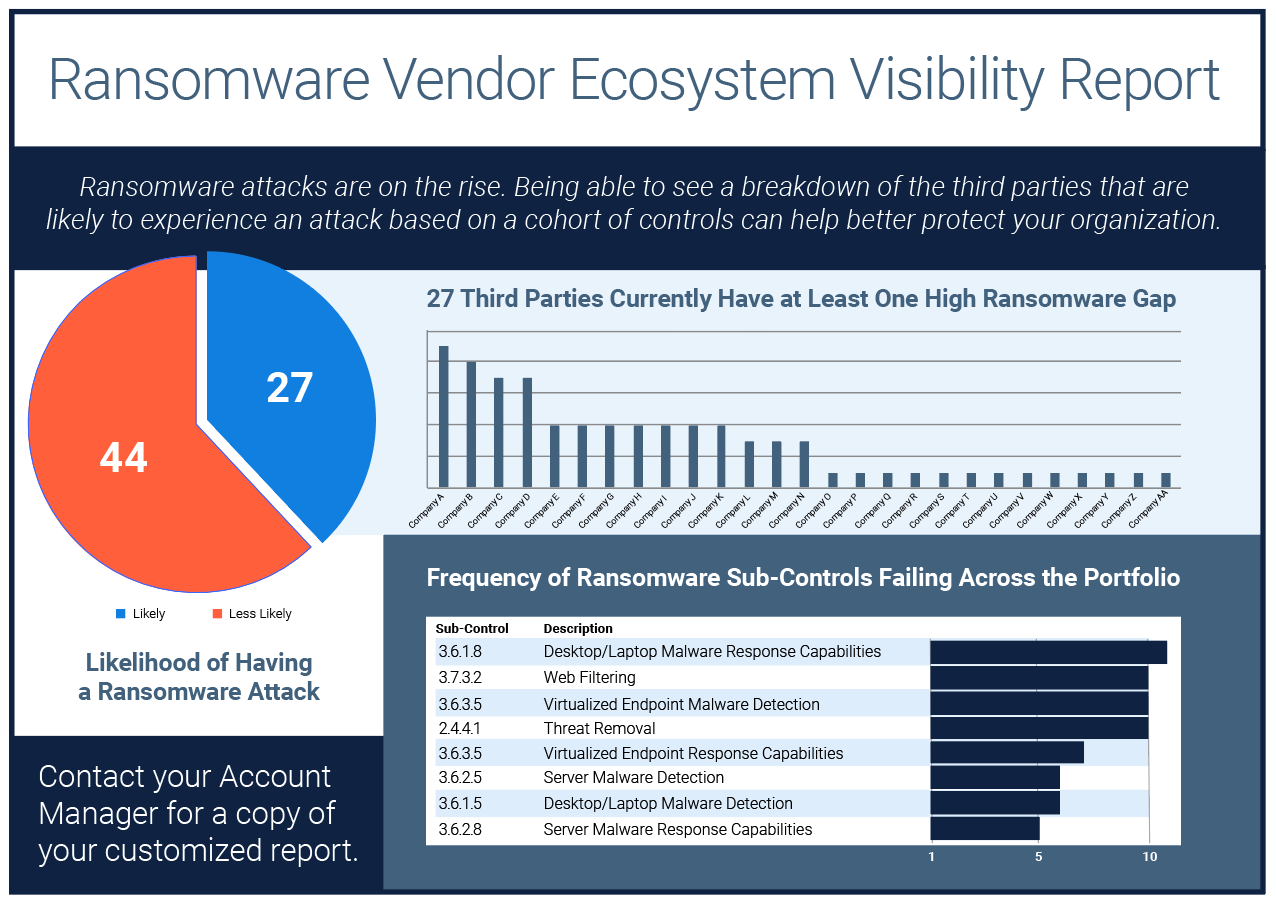
Ransomware Vendor Ecosystem Visibility Report
If knowledge is power, then visibility is the secret weapon against ransomware and extortionware.With our..
Learn More
7 of the Most Famous Ransomware...
As we mentioned in a previous post, ransomware attacks have been happening for many years..
Learn More
Diversity and Inclusion as a Third-Party...
Diversity and inclusion initiatives are helping organizations to increase profitability, boost their reputation and even..
Learn More
The Evolution of Ransomware
Ransomware is a type of malware that when deployed, encrypts files on a victim’s computer..
Learn More
What is Fourth Party Risk and...
As we’ve seen in recent events such as the SolarWinds hack, third-party risk poses a serious threat to business continuity. What the..
Learn More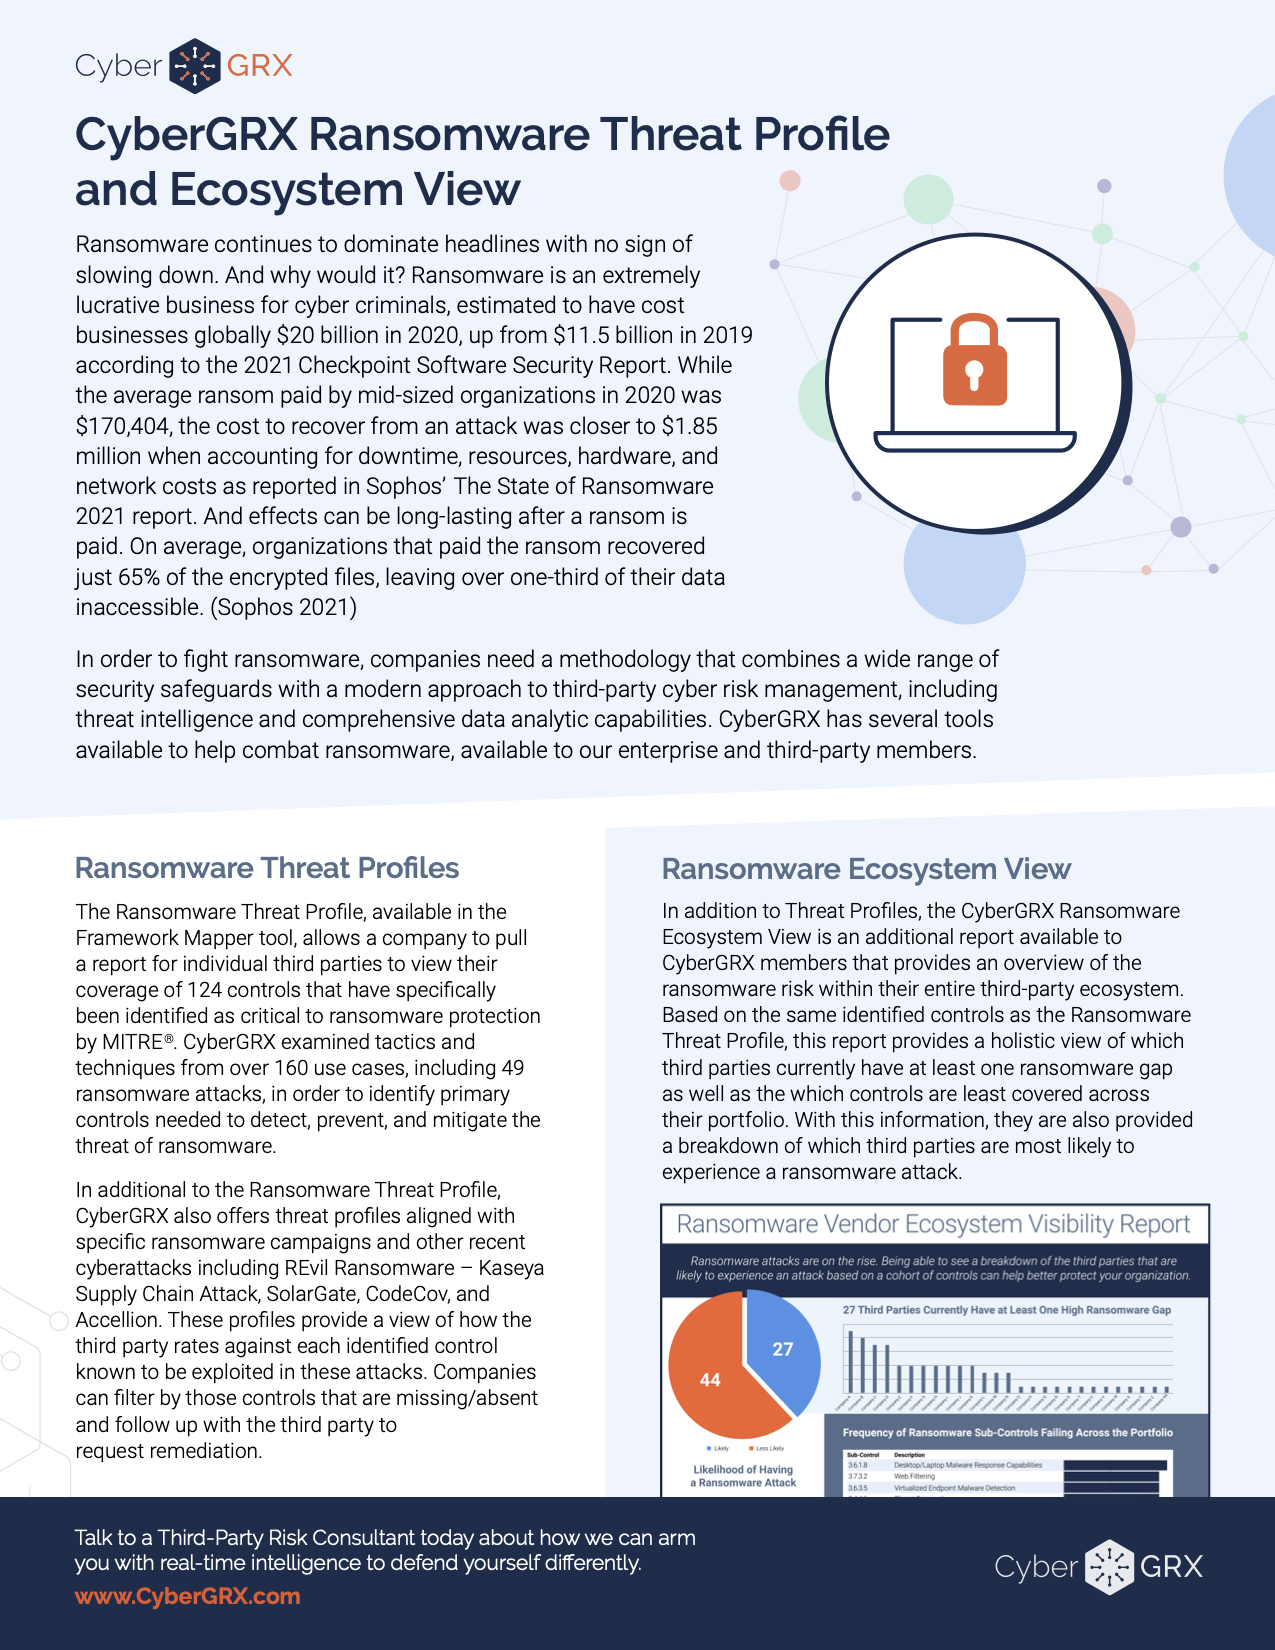
CyberGRX Ransomware Threat Profile & Ecosystem...
In order to fight ransomware, companies need a methodology that combines a wide range of..
Learn More
Exchanges, GRC Tools, and Risk Scans:...
It’s like comparing apples to baseball stadiums: If you are (or will be) evaluating solutions..
Learn More
Supplier Risk Management Strategies for Healthcare...
The COVID-19 pandemic served as a wake-up call for supplier risk management programs globally. Formerly reliable..
Learn More
REvil’s Reign: Kaseya VSA Ransomware Supply...
Recently, thousands of Kaseya VSA servers were exploited using a malicious update payload. Bypassing access..
Learn More
The Next Kaseya Breach is Around...
While the July 4th weekend meant celebrating the United States’ Independence Day holiday for some,..
Learn More
Setting Up A Cybersecurity Assessment Schedule
Building an Informed Cybersecurity Assessment Schedule Managing a cybersecurity program demands regular reviews of key..
Learn More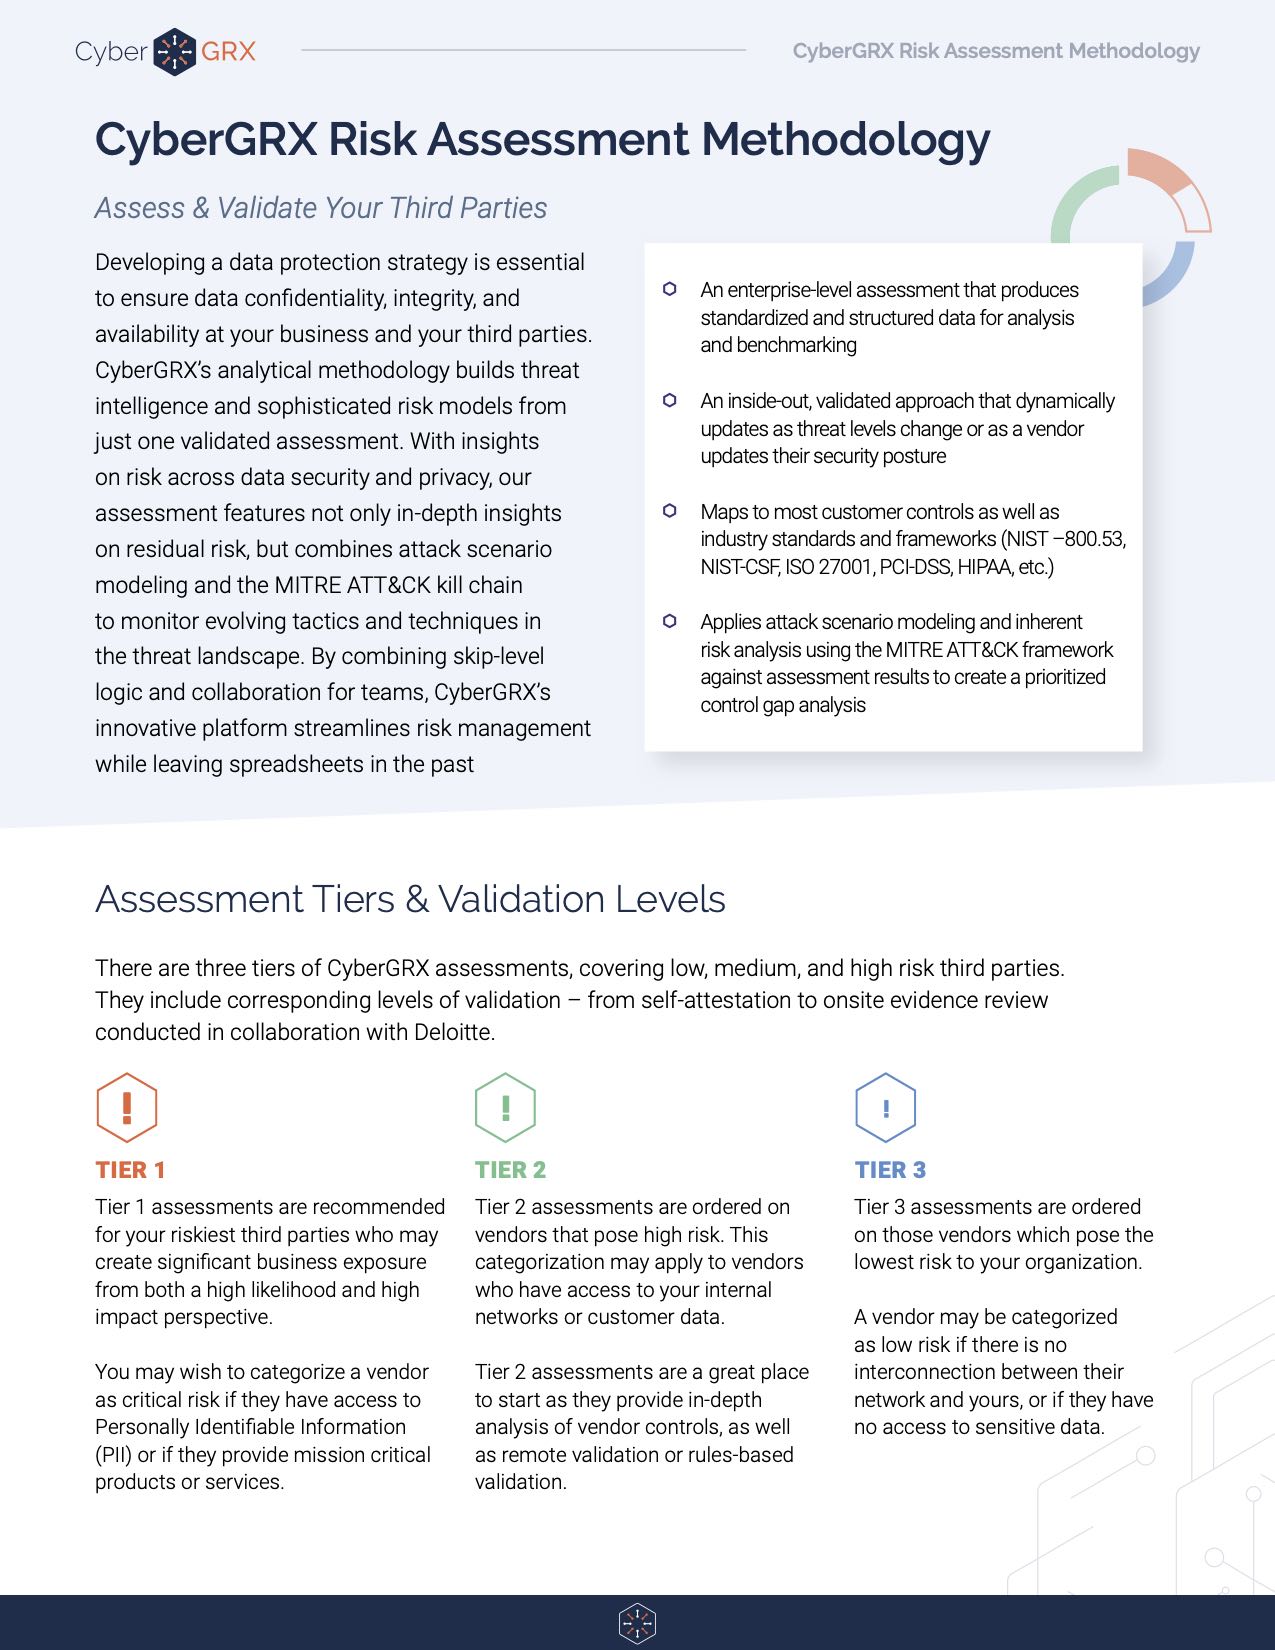
Risk Assessment Methodology Data Sheet
CyberGRX cloud-based assessments are the industry’s only comprehensive assessment methodology to manage risk across security,..
Learn More
Managing a Cybersecurity Budget: Where to...
As humans, we all have fight or flight instincts that kick in during dire situations...
Learn More
How To Create A Barebones Production...
I’ve recently had the opportunity to step into a tech lead role at CyberGRX, and..
Learn More
The Impact of NERC and FERC...
Cyber threats and their subsequent attacks are dominating news headlines globally. The recent SolarWinds attack..
Learn More
Your Cybersecurity Budget is a Top...
Cybersecurity is recognized as an increasingly important annual budget spend, with many organizations declaring their cybersecurity..
Learn More
Anatomy of a Third-Party Data Breach
According to research done by the Ponemon Institute, third-parties are involved in over half of..
Learn More
Why Vendor Risk Management is Essential...
Third-Party Risk in Healthcare When it comes to vendor risk management in healthcare, regulators increasingly..
Learn More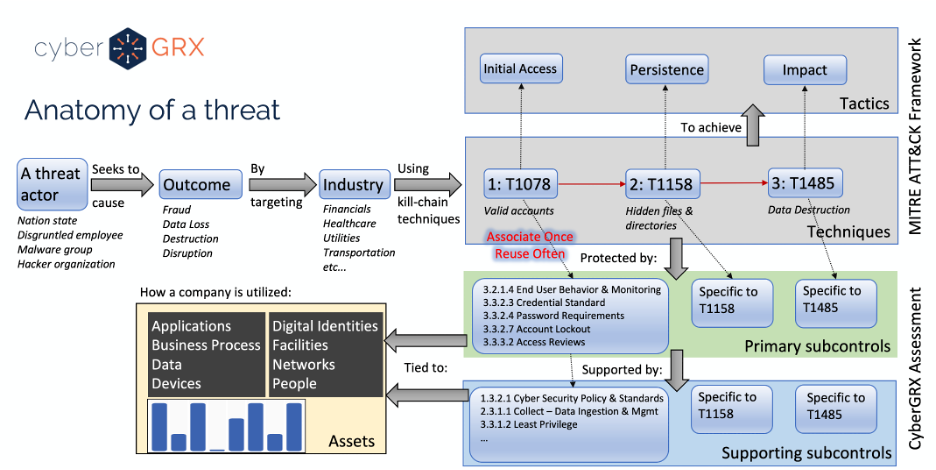
Cybersecurity Analytics: Integration With the MITRE...
Deriving insights from a cybersecurity assessment requires the structure of real-world threat narratives. Companies in..
Learn More
The Benefits of a Centralized Cybersecurity...
Implementing a centralized Cybersecurity Program Management platform can pay dividends for your organization by protecting high-value..
Learn More
Do You Really Know Who Your...
Money laundering; bribery and corruption; drug trafficking; and terrorism financing are issues that are rapidly infiltrating business operations. In recent years,..
Learn More
3 Secrets to Building a Winning...
Did you know third-party breaches account for over half of all data breaches in the..
Learn More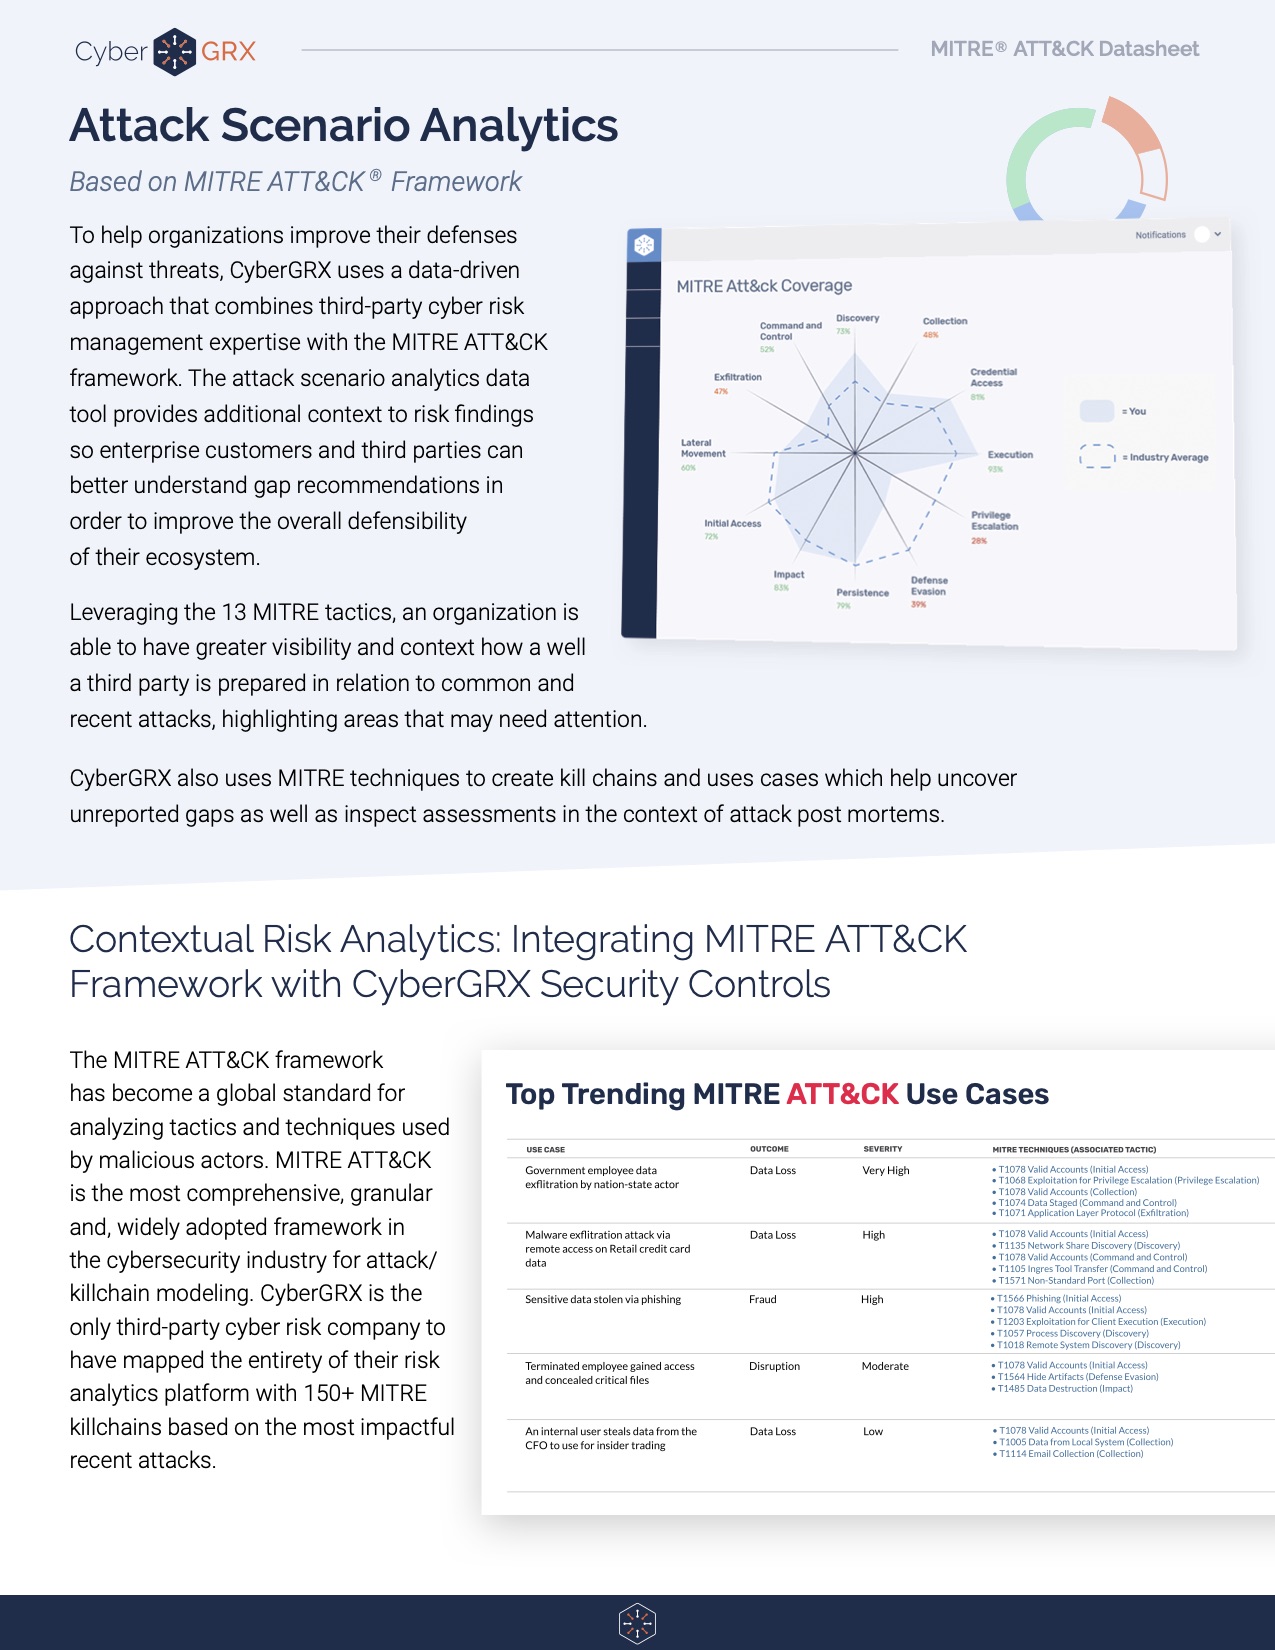
Attack Scenario Analytics: A Datasheet Reference
The MITRE ATT&CK framework has become a global standard for analyzing tactics and techniques used..
Learn More
Expert Tips for Setting up a...
Assessing Third Party Risk with a Vendor Questionnaire Vendors deliver reduced costs and increased productivity, making them very advantageous for business strategy...
Learn More
Vendor Risk Management & ESG Related...
The Emerging Importance of ESG-Related Risk Environmental, social, and governance (ESG) and its role in vendor..
Learn More
CyberGRX Partners with Recorded Future to...
We're excited to announce we've formed a strategic partnership with Recorded Future, the world’s largest..
Learn More
What’s the Difference? Vendor Risk vs...
The words are frequently used interchangeably. Is there a difference between them? The Basics of Third Party..
Learn More
The Intersection of Third-Party Risk and...
According to a recent BlueVoyant, Opinion Matters global study of 1,500 CISOs, CIOs, and CPOs, 29 percent say they have..
Learn More
Solarwinds Hack: The Intersection of Cybersecurity...
The continuing fallout from the SolarWinds hack is creating a mashup of Cybersecurity Program Management stuffed..
Learn More
Anti-Bribery & Corruption (ABAC) in Business...
The impacts of corruption can be very severe and have been historically well documented. On a political level, corruption – however and wherever..
Learn More
The Cyber Info Exchange Episode 7:...
The world of technology and security covers a magnitude of critical topics in all things..
Learn More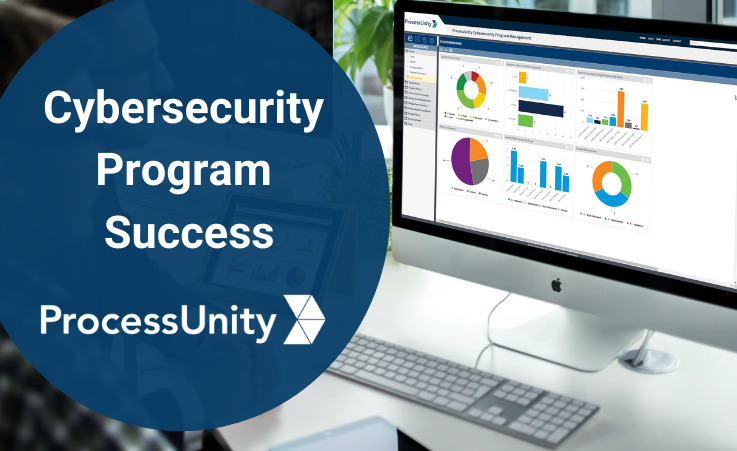
Cybersecurity Accountability Requires Enterprise-Wide Involvement
Cybersecurity is every employee’s responsibility. To ensure success, organizations today need to weave cybersecurity accountability into the..
Learn More
8 Key Reports You Need for...
The foundation for an effective vendor risk program starts with solid reporting. As your vendor..
Learn More
Stay Ahead of the Cybersecurity Threat...
Understanding today’s ever-evolving cybersecurity threat landscape is essential for developing strategies and taking action to..
Learn More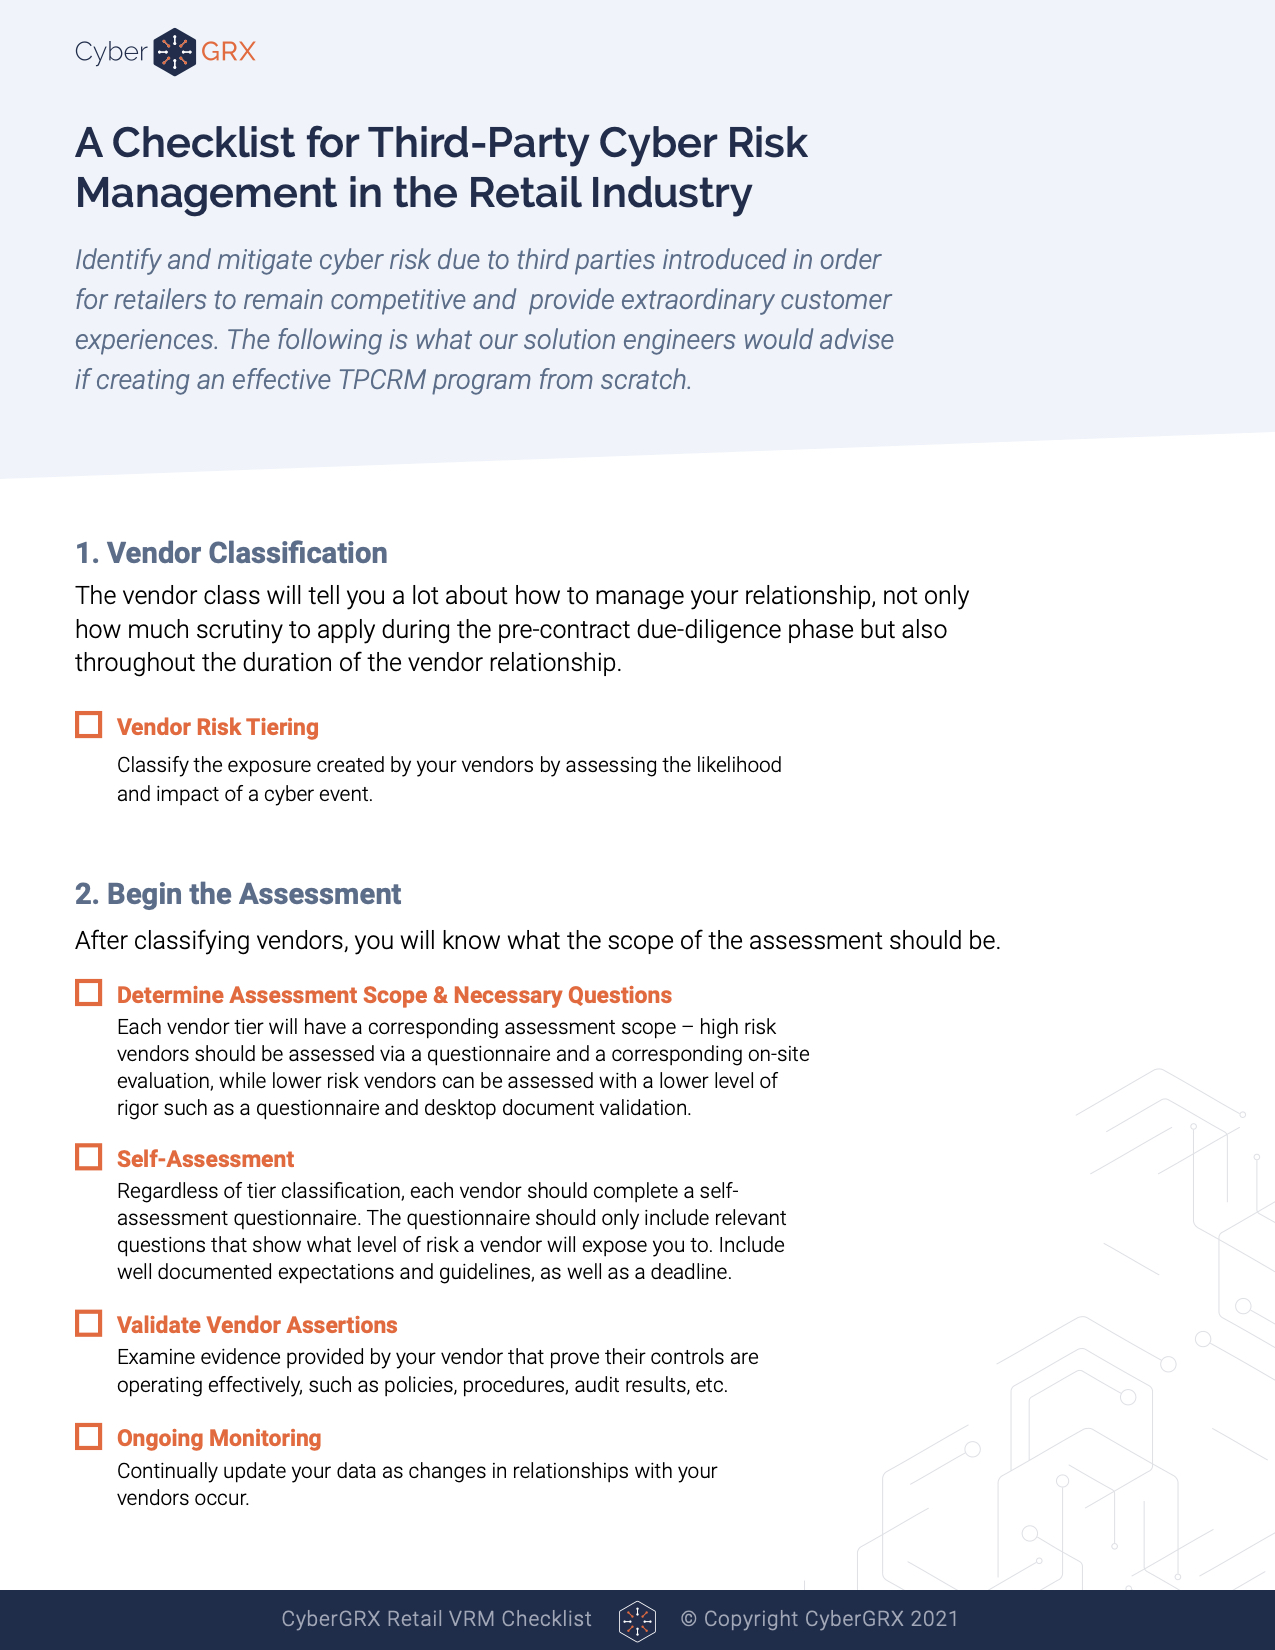
Checklist: TPCRM in the Retail Industry
The CyberGRX platform brings visibility, scalability, and accuracy to third-party cyber risk management programs (TPCRM)..
Learn More
Stop Wondering if You're Compliant: The...
Regulations and compliance requirements are constantly changing, and this can make it challenging to efficiently maintain compliance...
Learn More
Tips for Quantifying Inherent Risk for...
Quantifying inherent risk for third parties is one of the most important aspects of a..
Learn More
The Cyber Info Exchange Episode 6:...
The world of technology and security covers a magnitude of critical topics in all things..
Learn More
What Is Third-Party Risk Management: The...
The recent SolarWinds breach has reminded news organizations, businesses, and leadership teams around the world..
Learn More
The Importance of a Flexible Cybersecurity...
It goes without saying: Your cybersecurity threat landscape is continually evolving, and new risks emerge each day. Trends..
Learn More
EBA Guidelines and Supplier Risk Management
Today’s distributed, business environment is defined by third-party relationships. The boundaries of the organization have..
Learn More
How to Stop the Next SolarWinds...
The SolarWinds breach, while incredibly serious, is a flash in the pan brought upon by..
Learn More
Reporting on the State of Your...
The CISO’s Role and Cybersecurity Program Evolution As the role of the CISO changes and..
Learn More
Cybersecurity Risk has Changed the Chief...
In the past, the Chief Information Officer (CIO) was responsible for all things technology, but..
Learn More
How to Address The Top Third-Party...
Third-party risk management, or TPRM, is a critical part of keeping your company’s and customers’..
Learn More
What is a Cybersecurity Framework?
A cybersecurity framework is the foundation on which your program is built. It documents the..
Learn More
8 Benefits of Completing a CyberGRX...
CyberGRX modernizes and streamlines redundant and inefficient processes that come with shared and static..
Learn More
Are Third-Party Cloud Applications Putting Your...
In May of 2017, it was discovered that an exposed data repository, an AWS S3..
Learn More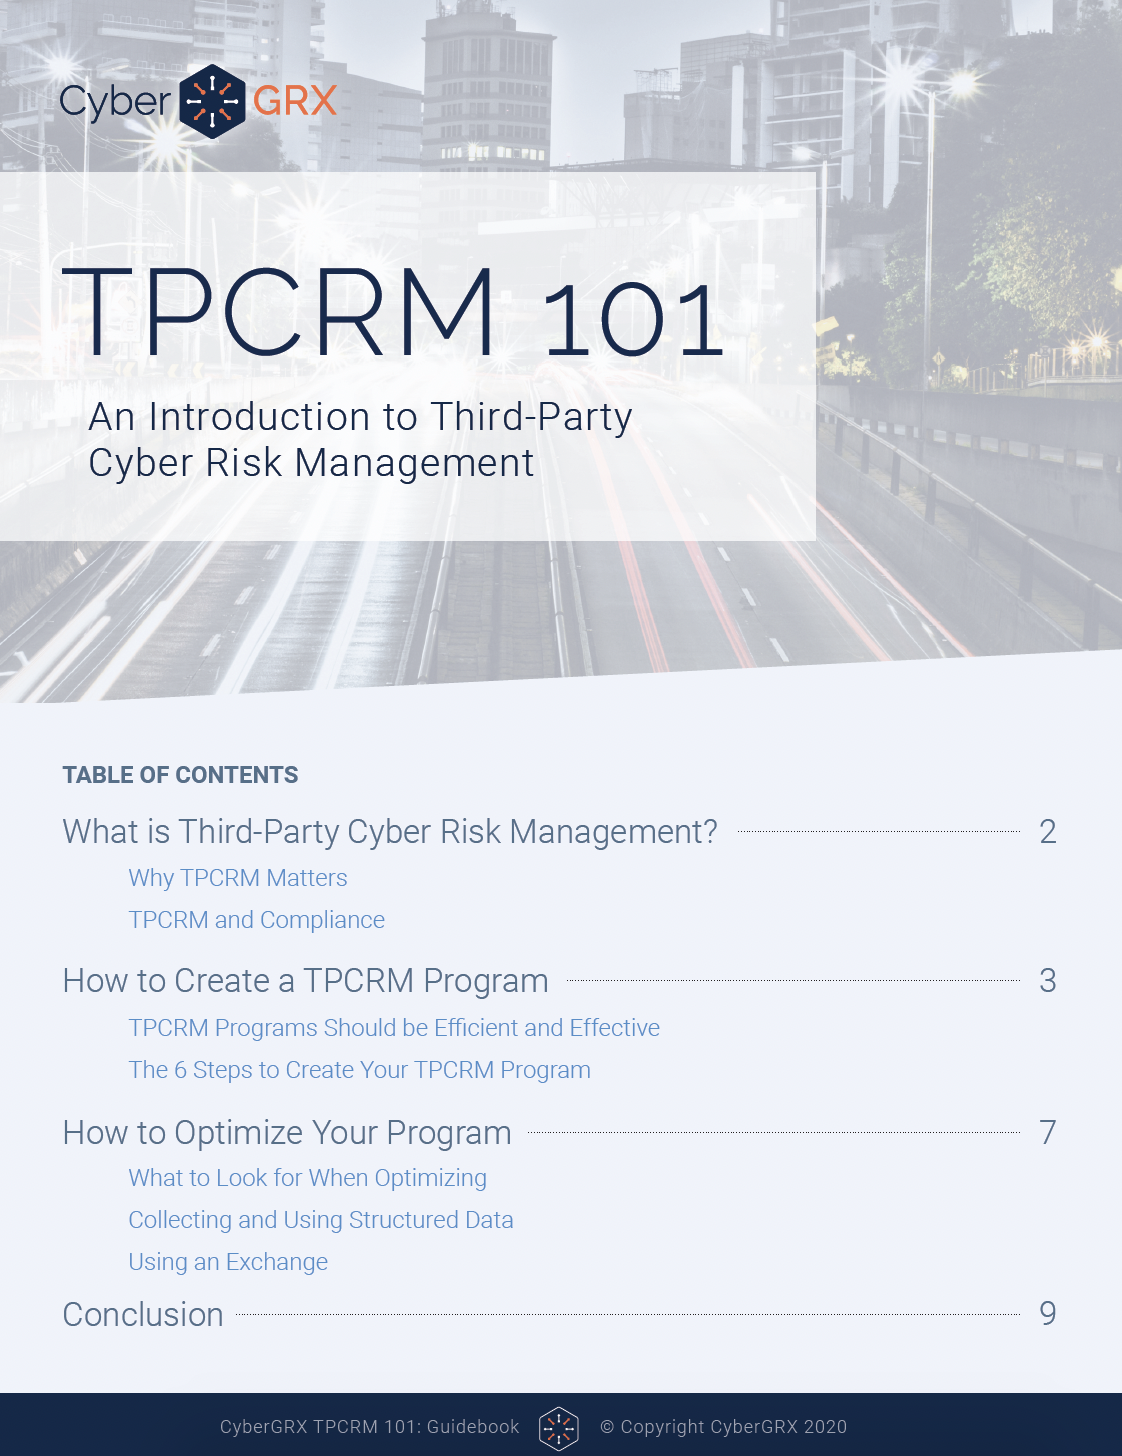
TPCRM 101 Guidebook
In the cyber sphere, NIST, ISO, AICPA, and DHS are among the multiple organizations that..
Learn More
Gartner Names ProcessUnity a Leader in...
The title says it all – Gartner has again recognized ProcessUnity as a Leader in..
Learn More
Why Vendor Risk Management Should Be...
As the severity and cost of data breaches continues to increase, Vendor Risk Management has never been..
Learn More
What is Data Privacy and How...
The General Data Protection Regulation (GDPR) brought data privacy issues to the doorstep of organizations..
Learn More
The Evolution of the Third-Party Due...
To compete in today’s marketplace, companies routinely engage third parties to provide all manner of..
Learn More
QBE: Improving Oversight of Third Parties...
As a major insurer operating in 27 countries, QBE has a large vendor footprint and..
Learn More
Procurement or Information Security: Who Owns...
There is no right answer to which team should own Third-Party Risk Management, but effective..
Learn More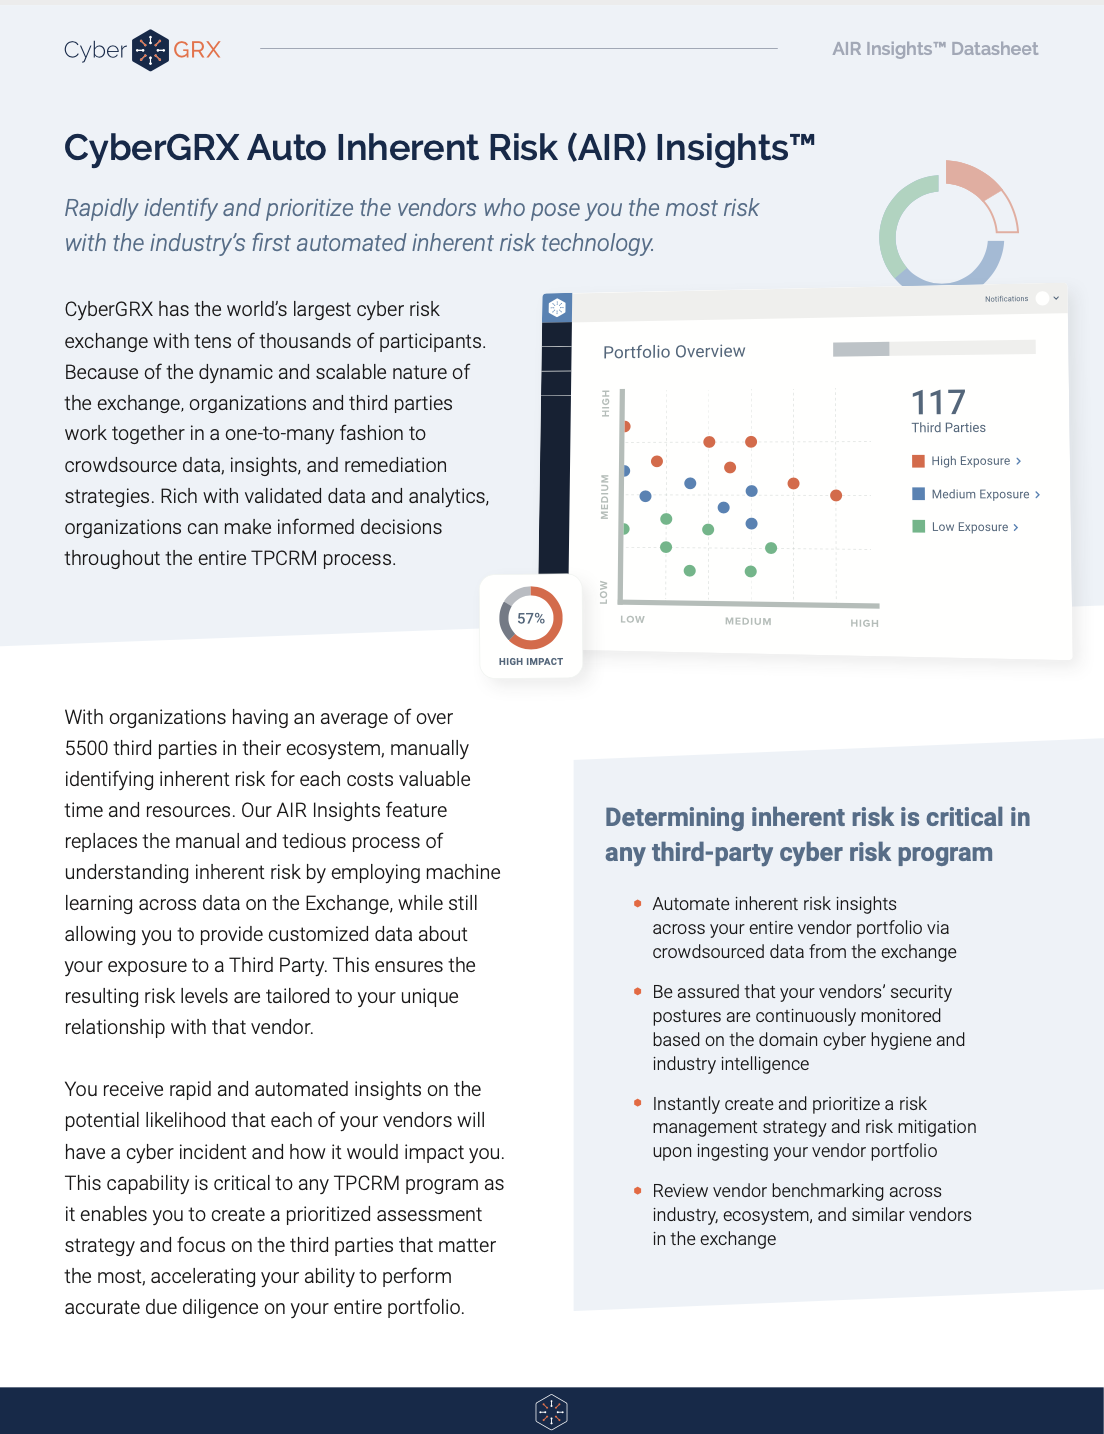
Auto Inherent Risk Data Sheet
If you’re still using static assessments, you’re likely missing out on vital risk intelligence. CyberGRX..
Learn More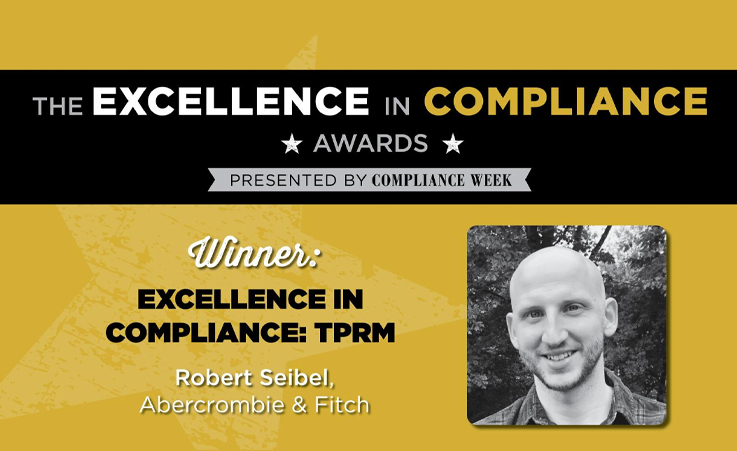
Compliance Week Recognizes Abercrombie & Fitch’s...
Congratulations to Rob Seibel, Director of Legal Compliance at Abercrombie & Fitch Co., for receiving..
Learn More
7 Security Controls You Need For...
It’s no secret that data protection and security has become a hot topic in recent..
Learn More
Revolutionizing Third Party Risk: How to...
Despite their best efforts to administer an efficient and effective process, many organizations spend an..
Learn More
Pandemic Questionnaire Guidance & Vendor Assessment...
Before the emergence of COVID-19, third-party risk management programs were executing in a business-as-usual mode,..
Learn More
The Cyber Info Exchange Episode 5:...
The world of technology and security covers a magnitude of critical topics in all things..
Learn More
The Cyber Info Exchange Episode 4:...
The world of technology and security covers a magnitude of critical topics in all things..
Learn More
How Third-Party Risk Management Can Help...
This post originally appeared on LinkedIn. To view the original article, click here. We understand the..
Learn More
How to Spot Your Riskiest Vendors:...
Maintaining strong relationships with third parties is critical to business success. Yet too often, does..
Learn More
Third-Party Risk Management: From A to...
Just as the mind, body and spirit are intertwined, there are several interconnected pillars to..
Learn More
APRA CPS 234: Everything You Need...
The Office of the Australian Information Commissioner reported that there were over 950 data breaches..
Learn More
Metrics to Avoid When Discussing Cybersecurity...
Chief Information Security Officers (CISOs) have one of the toughest jobs in the C-Suite. They..
Learn More
2019 Was A Banner Year for...
ProcessUnity just finished up another banner year – it’s an exciting time to be in..
Learn More
Outside-In Scanning Is Not Cyber Risk...
Risk management is fairly straight-forward as a strategic concept but is complicated by a myriad..
Learn More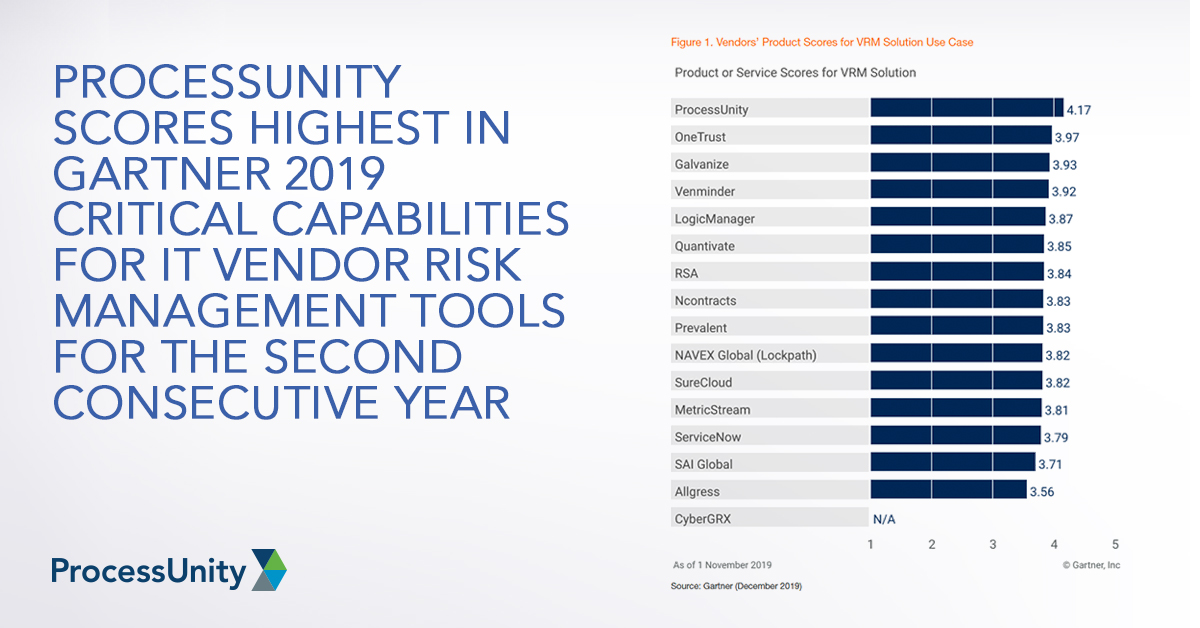
ProcessUnity Scores Highest in Gartner 2019...
Gartner recently published the 2019 Critical Capabilities for IT Vendor Risk Management Tools, and we..
Learn More
CPG Case Study
With an extensive portfolio of third-parties, a leading CPG company needed a streamlined third-party cyber..
Learn More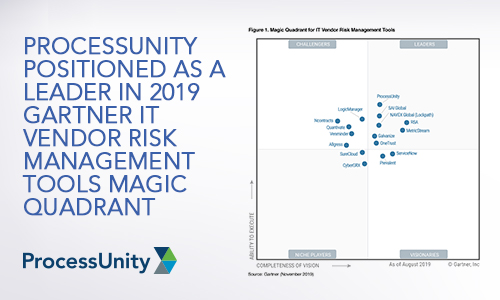
ProcessUnity Positioned as a Leader in...
We have great news. Today, Gartner published the 2019 Magic Quadrant for IT Vendor Risk..
Learn More
What the European Banking Authority Guidelines...
Using the European Banking Authority (EBA) guidelines to streamline your supplier risk management program Simply..
Learn More
Solix Case Study
Solix Shares the CyberGRX Assessment Driving Business and Saving Time One Assessment For All After..
Learn More
The Latest CCPA Update: Amendments to...
As we learned from, “A Finance Exec, A Real Estate Developer, And a Former CIA..
Learn More
Why Your Third-Party Risk Management Program...
The vast majority of people get annual physical examinations and automotive tune-ups – why shouldn’t..
Learn More
How To Improve Your Third-Party Inherent...
More than two-thirds of companies are cutting corners when it comes to third-party due diligence..
Learn More
The Latest Retail Breaches: Third-Party Data...
Third-party data breaches have been dominating the headlines in 2019, with a lot of the..
Learn More
CCPA and GDPR Compliance for IT...
For many of us that work in IT Fields, the requirements of privacy bills like..
Learn More
Sarbanes-Oxley Compliance: Five Steps to Cleaning...
While Sarbanes-Oxley (SOX) compliance management may be old hat for some, organizations today continue to..
Learn More
CyberGRX Enriches Third-Party Cyber Risk Management...
CyberGRX Auto Inherent Risk Automates a Time-Consuming, but Critical Step, Bringing Immediate and Valuable Insights..
Learn More
Hey Third Parties! Here's How to...
If you have a partner that trusts you with their business – and therefore, data..
Learn More
Tips for Preparing For Your Third-Party...
Being the target of a cybersecurity assessment can be frightening. Cybersecurity covers a broad set..
Learn More
How Financial Ratings and Cybersecurity Scores...
RapidRatings, Security Scorecard and BitSight Enhance Vendor Risk Management Process As a standalone solution, ProcessUnity’s..
Learn More
Poll: Over Half of Risk Managers...
ProcessUnity recently participated in a live webinar with IT GRC and other leading Vendor Risk..
Learn More
First GDPR, Now CCPA: Manage Your...
One year ago, organizations of all sizes were scrambling to comply with the pervasive General..
Learn More
Essential Technical Security Controls to Promote...
One of the most impactful regulations in the U.S. is the Health Insurance Portability and..
Learn More
Evaluating Third-Party Risk Management Software? Speed...
Good vendor risk management practices are good for business. Unfortunately, most organizations today continue to..
Learn More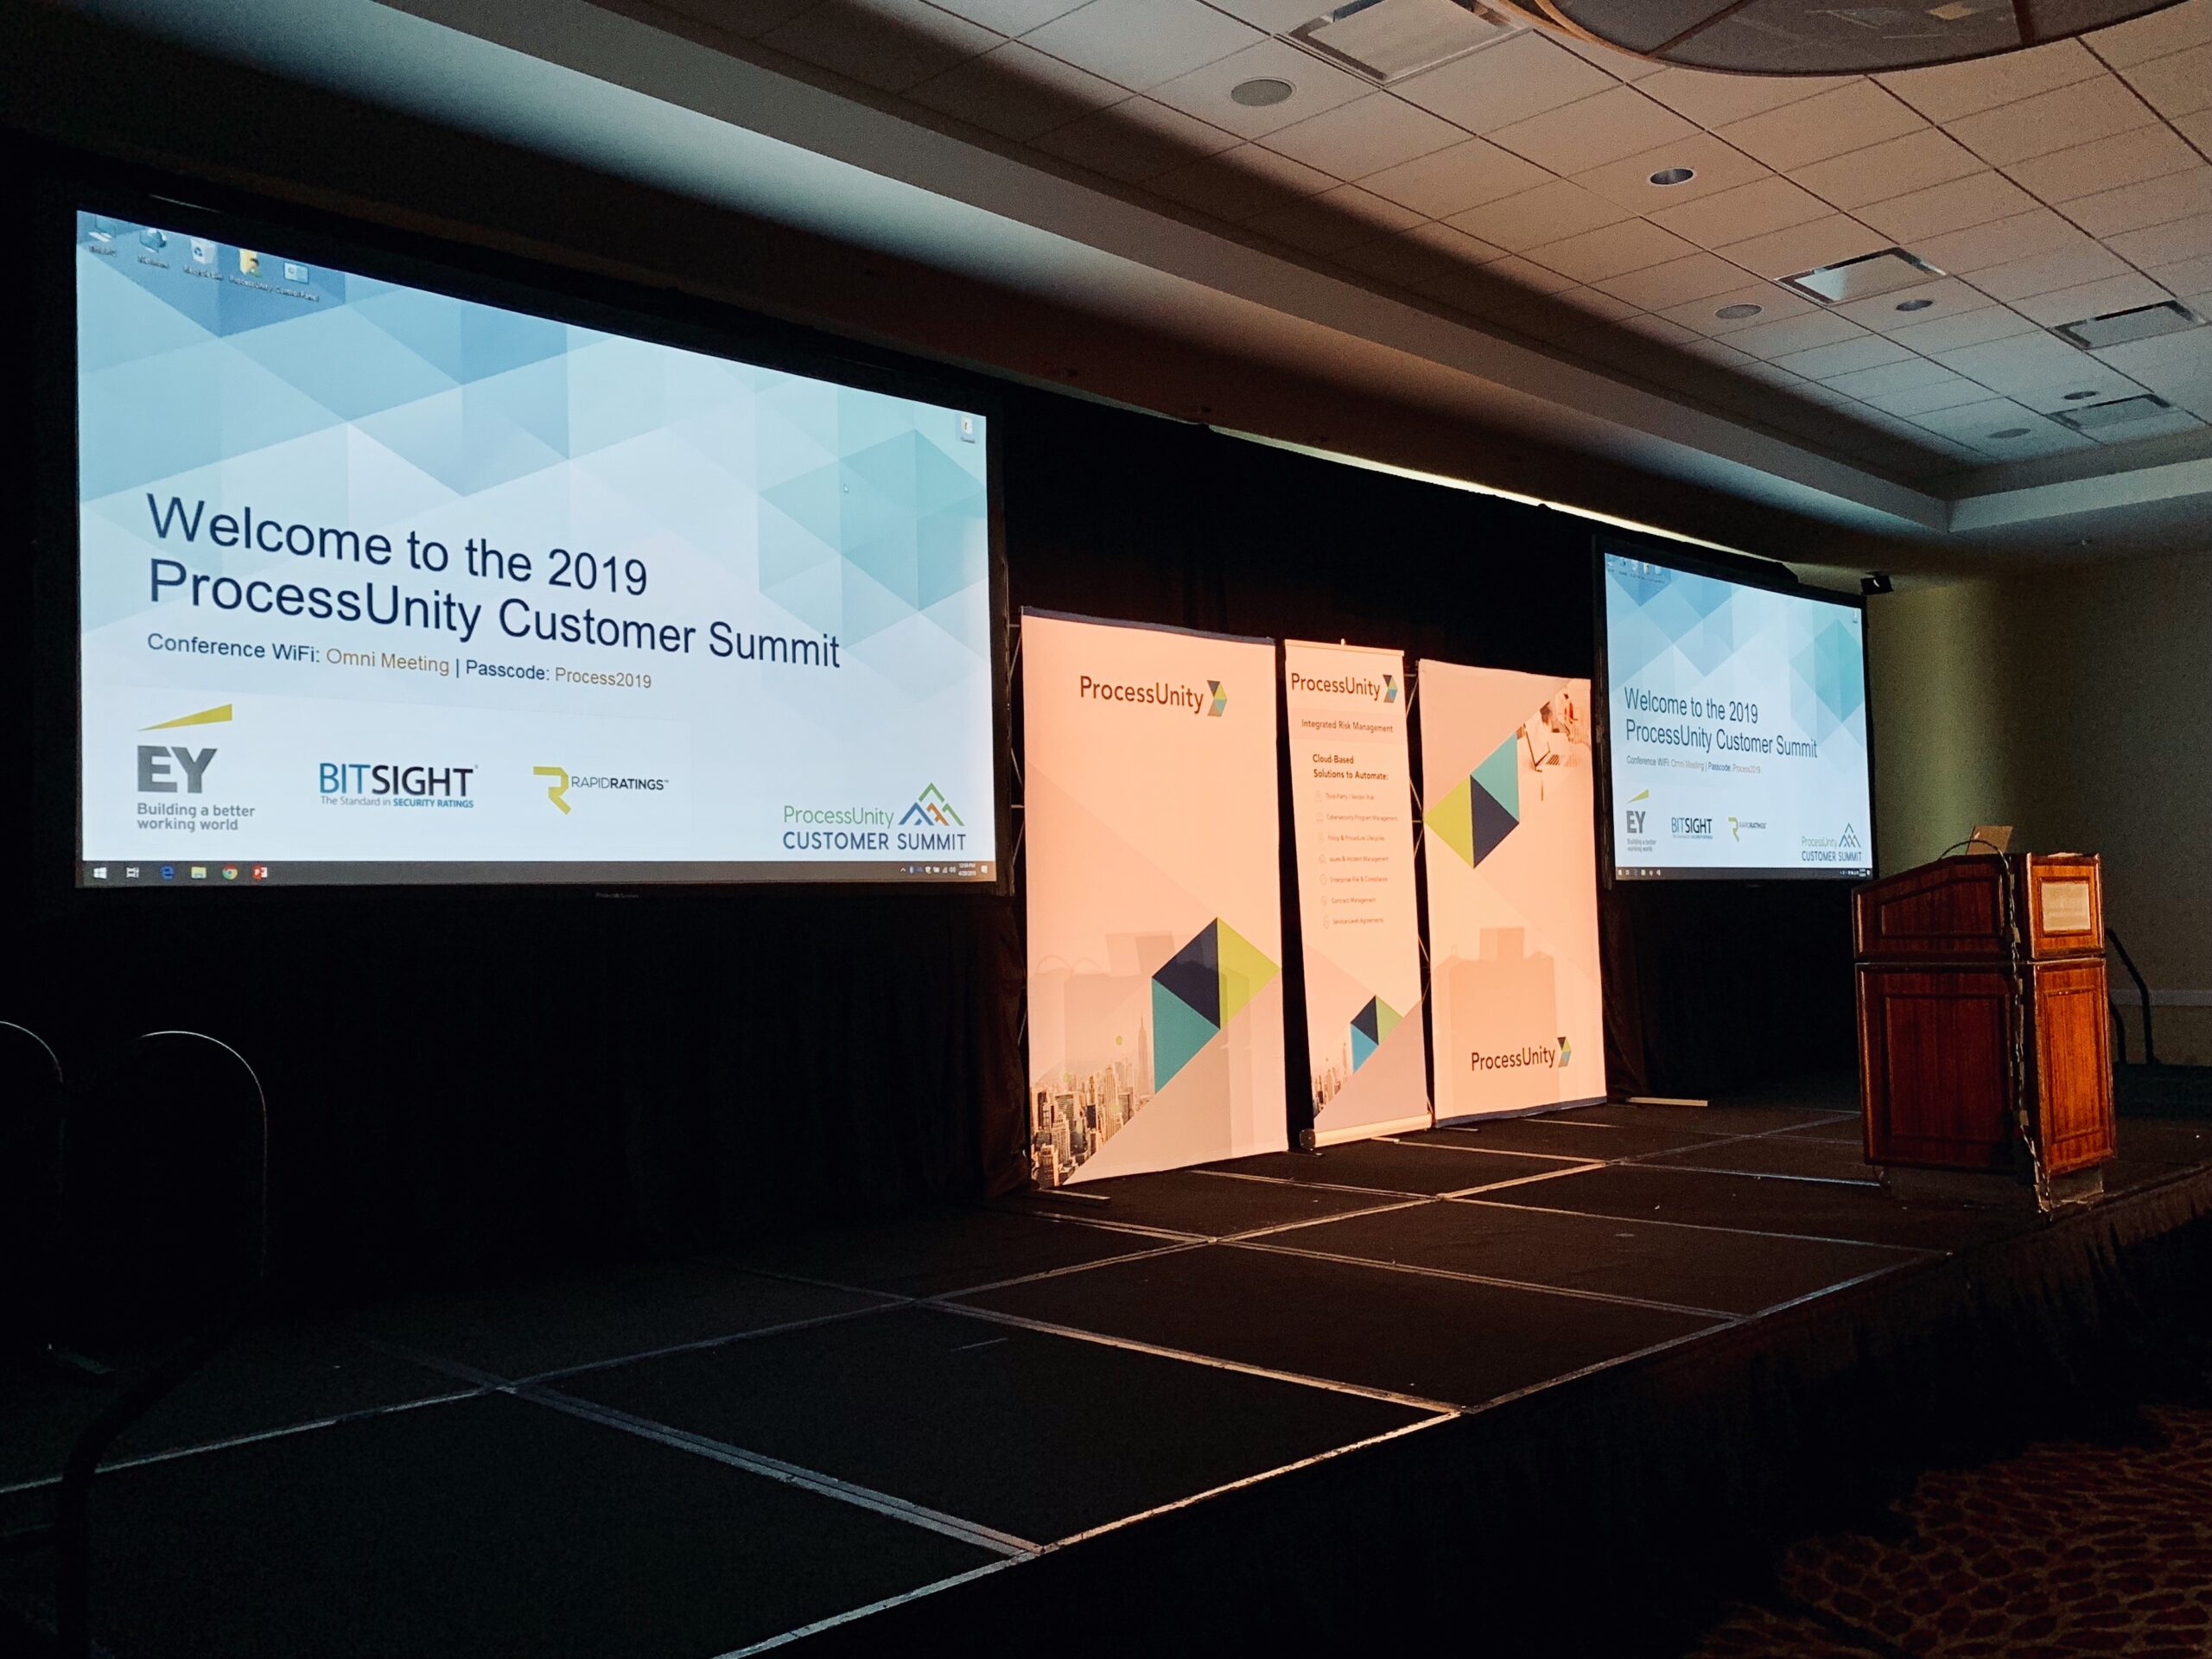
It’s a Wrap: Four Takeaways from...
The 2019 ProcessUnity Customer Summit is a wrap and what a week it was. We..
Learn More
Creating a Third-Party Cyber Risk Management...
I’ve spent almost 30 years in the IT security space and half of that engaged..
Learn More
Cyber Risk: What is it and...
Cyber risk is a hot topic these days, and rightfully so. By 2025, Gartner estimates that “45%..
Learn More
The Cost of Third-Party Cybersecurity Risk...
Third parties are inundated with assessments and enterprises aren't getting the insights they need -..
Learn More
Trust, But Validate: Building Confidence in...
Overview Security assessments come in all shapes and sizes. Some have tightly defined scopes and..
Learn More
How ComplySci Spends Less Time on...
ComplySci Proactively Shares CyberGRX Helps ComplySci Reduce Time Spent on Assessments with Proactive Sharing Proactive..
Learn More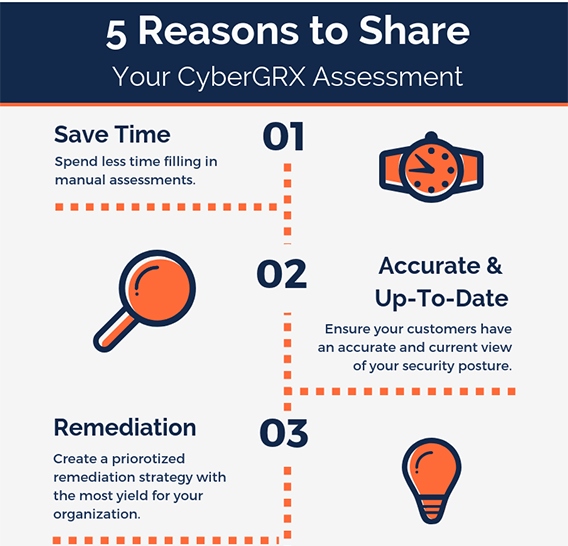
5 Reasons to Share Your CyberGRX...
One of the greatest benefits of having a CyberGRX assessment on the Exchange is the..
Learn More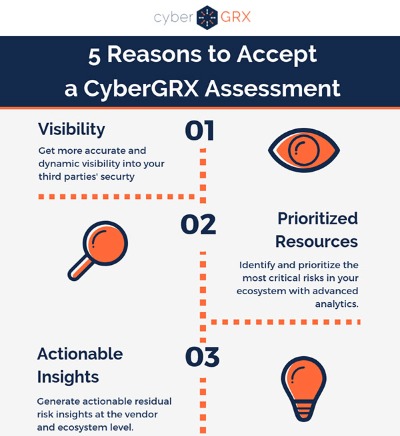
5 Reasons to Accept a CyberGRX...
A partner wants to share a CyberGRX assessment with you, why should you accept? Step..
Learn More
Third-Party Management Maturity Model White Paper:...
ProcessUnity’s recent white paper, the “Third-Party Risk Management Maturity Model,” helps you understand where your..
Learn More
New Gartner Report: Evaluates Capabilities and...
Gartner Research recently published The 2018 Critical Capabilities for IT Vendor Risk Management, and we are extremely excited..
Learn More
Technology Case Study
After a technology company doubled the size of their vendor ecosystem, they sought to secure..
Learn More
Third-Party Risk: Reduce Vendor Fatigue &...
You’ve likely heard before that “one size does not fit all” when it comes to..
Learn More
ComplySci Case Study
ComplySci Proactively Shares CyberGRX Helps ComplySci Reduce Time Spent on Assessments with Proactive Sharing Proactive..
Learn More
New Report Predicts Significant Market Growth
MarketsandMarkets has published a new report that states that the global Vendor Risk Management market..
Learn More
Vendor Onboarding Best Practices: ProcessUnity Webinar...
Vendor Onboarding Best Practices: To contract a vendor is to initiate a relationship: when you..
Learn More
Think GDPR (General Data Protection Regulation)...
Do you collect, store or process EU citizen or resident data? Does anyone in your..
Learn More
Risk & Compliance – The Build...
We’re not seeing it as much as we used to, but some companies are still..
Learn More
Incorporating Content Services into Your Vendor...
Companies are continually searching for ways to improve the quality of their third-party risk due..
Learn More
Regulatory and Management Reporting for Vendor...
In working with prospects and customers, one of the questions I get asked the most..
Learn More
SLAs and Vendor Performance Management
Not all business relationships require a service-level agreement (SLA), but good vendor performance management is..
Learn More
Formalizing Vendor Risk Management - Keep...
When starting to build a formal Vendor Risk Management program, it’s important not to overcomplicate..
Learn More
Six Tips for Building Effective Vendor...
A well-designed vendor risk assessment questionnaire is vital for a successful Vendor Risk Management program...
Learn More
The 2017 State of Third Party...
How does your program rate? Take the Third-Party Risk Management survey and find out! There..
Learn More
eBook: 8 Reports for Effective and...
The foundation for an effective and efficient Vendor Risk Management program is solid reporting. The..
Learn More
The Top Policy and Procedure Management...
Corporate policies – from HR guidelines to pricing rules -- set the standards, outline the..
Learn More
How to Stay Ahead of Risk...
Managing risk through pre-contract vendor due diligence in a digitally connected world Thanks to increasing..
Learn More
Mitigating the CFPB Audit Process
In the mortgage industry, the potential for an audit by the Consumer Financial Protection Bureau..
Learn More
Why Cloud Works for Third-Party Risk...
If you are running a Vendor Risk Management program, odds are that you either have:..
Learn More
The Hidden Costs of Spreadsheets in...
While spreadsheets are a widely-accepted go-to for compliance and risk management activities, findings from Blue..
Learn More
The State of Third-Party Risk Management
Today, organizations are bombarded by new regulatory guidance, daily occurrences of cybercrime and data breaches,..
Learn More
45-Minute Executive Web Clinic: Offer Management...
You’ve probably heard: The sky is falling in the benefits industry. (Or should we say..
Learn More
FFIEC Cybersecurity Assessment Tool: What You...
Cybercrime is a hot topic among GRC practitioners these days. It should be. According to..
Learn More
Case Study: Offer Management Revitalizes a...
A large Benefits Provider was facing major customer service and implementation challenges. The company provides..
Learn More
Change Your SOX: Next-Gen Sarbanes-Oxley Compliance
It’s been more than a decade since Sarbanes-Oxley became the law of the land—and..
Learn More
Introducing ProcessUnity’s Summer 2015 Release
Salesforce and Microsoft Office Integrations, plus a Whole New Look! The ProcessUnity Summer 2015 product..
Learn More
Channel Your Inner Regulator to Improve...
If you are like most banks and financial service companies, then chances are you outsource..
Learn More
Five Keys to Conducting Effective Vendor...
Risk exposure is indiscriminate. Whether you are a large multinational, a non-profit institution, an agency..
Learn More
A Roadmap for Implementing Product and...
“Benefit plan providers are turning to Offer Management initiatives and systems to reduce risk, cost..
Learn More
Plan Providers: Use Offer Management to...
In today’s intensely competitive benefit plan market, getting your teams aligned creates a dramatic competitive..
Learn More
Does Your Pre-Contract Due Diligence Leave...
Today’s global, digital economy opens up a world of opportunities—and a whole new world of..
Learn More
Welcome to the ProcessUnity Blog
On behalf of the ProcessUnity team, I am excited to welcome you to the new..
Learn MoreAbout Us
ProcessUnity is the Third-Party Risk Management (TPRM) company. Our software platforms and data services protect customers from cybersecurity threats, breaches, and outages that originate from their ever-growing ecosystem of business partners. By combining the world’s largest third-party risk data exchange, the leading TPRM workflow platform, and powerful artificial intelligence, ProcessUnity extends third-party risk, procurement, and cybersecurity teams so they can cover their entire vendor portfolio. With ProcessUnity, organizations of all sizes reduce assessment work while improving quality, securing intellectual property and customer data so business operations continue to operate uninterrupted.